INTRODUCTION
Helicobacter pylori (H. pylori) is a Gram-negative pathogenic bacterium that grows in gastric mucosa causing gastric ulcers. Globally, 50% of the population has been infected with the bacteria [1]. H. pylori causes atrophy and chronic gastritis resulting in inflammation and ulceration of stomach linings. Symptoms of the infection include abdominal pain and loss of hunger, and may also lead to lethal complications like bleeding in the stomach [2]. If the inflammation persists, it may also result in gastric cancer [3–6]. Immune thrombocytopenic purpura, iron deficiency anemia, and vitamin B12 insufficiency are also the other disease conditions of the infection [7,8]. The infection is transmitted orally, mainly by consumption of contaminated food products and water [9]. The infection may be asymptomatic in many infected individuals, yet they can be potential carriers for disease transmission.
Most bacteria entering the stomach will not survive its harsh acidic conditions. However, the peculiar pathophysiology in H. pylori enables the organism to survive in the acidic conditions of the gastric mucosa. The organism contains a special enzyme, urease, which hydrolyses urea in its vicinity to ammonium hydroxide, responsible for neutralizing the hydrochloric acid present in the stomach, creating a less acidic microenvironment for the bacteria to survive. H. pylori then swim into the inner layer of the gastric mucosa with the help of flagella and adheres to the mucosal surface with adhesins, resulting in bacterial colonization [10–12].
The current treatment strategy for eradicating H. pylori consists of a combination of antibiotics and a proton pump inhibitor. This includes first-line, second-line, and quadrupole therapies with various combinations of antibiotics. However, the special pathophysiology of the organism and ability to form coccoid helps the organism survive the treatment and develop resistance against antibiotics, preventing the eradication impossible [13–15]. Antibiotic resistance is caused by chromosomal mutation and physiological changes such s drug uptake, efflux mechanism, and biofilm formation, directly affecting the drug’s effectiveness in the infection. Antibiotics generally used for treating H. pylori are amoxicillin (AMX), metronidazole (MEZ), clarithromycin (CLR), tetracycline (TET), and levofloxacin (LEV). Earlier researchers have studied the resistance of these antibiotics. The primary resistance rates to H. pylori for AMX, CLR, MET, LEV, and TET were reported to be 15.0%, 34.1%–55.2%, 69.4%–71.3%, 18.4%–27.9%, and 17.9%, respectively [8]. The medication’s failure to reach the target site at the necessary concentration levels is the cause of this lack of effectiveness. Recent literature showed that resistance patterns vary based on the geographical area, age, gender, and prior use of the proton pump inhibitors.
AMX is a frequently used antibiotic due to its ability to re-secrete back to the gastric lumen, resulting in good bioavailability at the site where the bacteria resides [16,17]. Since H. pylori can survive in low-oxygen environments, doctors often prescribe antibiotics that are effective against anaerobic bacteria like MEZ in combination with AMX to treat H. pylori infection. AMX has bactericidal abilities and prevents the production of cell walls, whereas MEZ is used to treat infections produced by anaerobic bacteria. Both drugs have excellent tissue penetrability and good tolerability in the body [18–20]. The combination is considered to be an excellent choice for treating H. pylori infection [21,22]. The structure of AMX and MEZ is shown in Figure 1. The AMX and MEZ both are stable at gastric pH. Maintaining the antibiotic concentration at the site of H. pylori infection is important. The bioavailability of AMX and MEZ is 60%–70% and 90%, respectively [23].
 | Figure 1. Chemical structure of (a) AMX and (b) MEZ. [Click here to view] |
Pharmacosomes are lipid-conjugated vesicular structures that exist as hexagonal nano-sized micelles. These are used as drug carriers. Drug molecules with free hydroxyl, carboxyl, or amino functionality are converted to an ester, resulting in the formation of a pharmacosome. Pharmacological agents connect to lipids by electrostatic, covalent, or hydrogen bonding interactions. The complex possesses both lipophilic and hydrophilic properties, increasing the surface area of contact and thus the bioavailability [24–26]. Pharmacosomes also help in targeting the drugs to the site of infection [27–31]. As a part of our continuous research to find possible ways to eradicate H. pylori, we have prepared phrmacosomes containing AMX and MEZ.
To assess the stability, drug loading, % entrapment efficiency (% EE), and drug release profile of the antibiotics from the pharmacosomes, a validated analytical technique is required to quantify the selected antibiotics (e.g., AMX and MEZ) from the pharmacosomes. In this study, we have developed and validated a sensitive and accurate Reverse Phase-High Performance Liquid chromatography (RP-HPLC)-based analytical method employing modeling software such as design of experiment (DoE) [32–33]. DoE is a robust modeling approach used to predict chromatographic conditions that give the highest efficiency with fewer trials. It thereby also reduces the time and cost involved in the HPLC method development. Reducing the number of trials also saves solvent usage, thereby promoting the sustainability of the environment [34,35]. The consumption of organic solvents and other chemicals frequently employed in research labs is reduced in proportion to the number of experiments. This reduces the environmental effect of pharmaceutical research and development and is consistent with sustainable practice [36]. DoE helps researchers efficiently explore the relationships between multiple variables and their analytical responses [37,38]. The traditional HPLC method development strategy uses one factor at a time (OFAT) trials, which is time-consuming and expensive [39,40]. DoE helps reduce the number of trial runs and improves understanding of how these variables influence the overall method performance.
MATERIALS AND METHODS
Materials
A free sample of AMX (off-white powder; purity > 98%) was received from Sun Pharma, Gurgaon, India. MEZ (>98% purity) was purchased from Combi Blocks (CA, United States of America). Orthophosphoric acid (88%), HPLC grade acetonitrile, methanol, and hydrochloric acid (35%) were procured from Merck India Ltd, Mumbai, India. Milli-Q (purified water) was produced on-site using the instrument Direct Q3-UV system (Merck India Ltd, Mumbai, India). The membrane filter (0.45 μm) was procured from Merck India, Ltd, Mumbai, and the filtration assembly was procured from Riviera Glass Pvt. Ltd., Mumbai, India. The column of the stationary phase Luna octadecylsilane (ODS) C18 (250 × 4.6 mm, 5 µm particle size) was acquired from Phenomenex, Hyderabad, India. Dichloromethane (DCM) (>98% purity) was procured from Molychem, Mumbai, India. Soya lecithin (30%) a phosphatidylcholine was procured from Himedia Laboratories Pvt. Ltd., Thane, India.
Instrumentation
A Shimadzu HPLC system with an LC20-AD pump, SIL20-AC HT autosampler, CTO-10 ASVP column oven, and SPD-20A & SPD-M10A detectors with the LabSolution software was used for the optimization and validation of chromatographic methods. A calibrated Sartorius Mechatronics CP225D analytical balance (India) was used to precisely weigh the compounds used in the manufacture of standard solutions and buffers. A glass vacuum filtering assembly (Merck Millipore, Bangalore, India) was used to filter the mobile phase solution via a 0.22 µm membrane filter. The mobile phase solution was then degassed in an ultrasonic bath (GT Sonic, Guangdong GT Ultrasonic Co. Ltd, China). As needed, the pH of the mobile phase was measured and adjusted using a calibrated digital pH meter (Model: LI 617, ELICO, Telangana, India). To guarantee accuracy and precision in sample handling, calibrated variable micropipettes with capacities ranging from 0.2 to 10 µl, 10 to 100 µl, and 100 to 1,000 µl (Eppendorf, Germany) were used for various pipetting phases during sample processing.
Preparation of mobile phase and standard solution
The mobile phase combines 80% of 10 mM potassium dihydrogen phosphate buffer and 20% v/v methanol. The pH of the buffer was adjusted to 6.0 using orthophosphoric acid. The buffer was sonicated and passed through a 0.2 µm membrane filter after pH adjustment.
Primary stock solutions (1 mg/ml) of AMX and MEZ were prepared by dissolving 10 mg of pure standards in 10 ml of Milli Q water. Working standard solutions (100 µg/ml) of AMX and MEZ were prepared by dilution of the primary stock solution. Calibration solutions in the 0.5 to 20 µg/ml range were prepared from the working standard solution.
DoE-aided modeling of the HPLC method
DoE is the modeling tool that helps to understand the effect of variables and the interactions that can affect the responses. To clearly illustrate the effect of this method DoE tool was employed to optimize the effects of various processing variables on the chromatographic method such as retention time (tR), peak area, and resolution. The independent parameters included the mobile phase ratio, buffer pH, flow rate, and injection volume. Preliminary trials with OFAT were conducted to find the variables that affect the drug’s separation. Box-Behnken design (BBD) and central composite design (CCD) are the designs used for the optimization [41,42]. The BBD has the advantage that it requires less runs compared to the CCD. The BBD is frequently chosen over the CCD because of its efficiency and practicality. BBD usually necessitates fewer experimental runs, saving money while yielding reliable data for optimization. All experimental circumstances are safe and feasible since BBD stays away from extreme combinations of factor levels present in CCD. Better quadratic impact estimation is made possible by this design’s emphasis on mid-level parameters, which eliminates the potential complexities that come with extreme values. Furthermore, BBD is especially helpful for well-informed procedures where the center of the design space is anticipated to be optimal. Regarding experimental design, BBD is useful since it provides a simplified method that strikes a compromise between thoroughness and resource efficiency. In the BBD model, we selected four chromatographic parameters as the independent variables for the five responses. The Design Expert®, version 9.0.1. (Stat-Ease Inc, USA) was used to model the HPLC method. The input parameters in their lower and higher ranges were % aqueous (buffer) phase (A) ranging from 75% to 95%; buffer pH (B) ranging from 6.0 to 6.8; mobile phase flow rate (C) ranging from 0.8 to 1 ml/min; and injection volume (D) ranging from 10 to 20 µl. Based on the input, DoE suggested 29 trial conditions for the model development. We performed trials in HPLC with the recommended parameters and the responses obtained are provided in Table 1. The responses were the tR of AMX (Y1), tR of MEZ (Y2), peak area of AMX (Y3), peak area of MEZ (Y4), and resolution (Y5). The response was analyzed using ANOVA and the p value, determination coefficient (R2), adjusted determination coefficient (adj R2), and predicted determination coefficient (pred R2) were analyzed. Surface analysis was carried out generating 3D-response surface graphs and perturbation plots. The 3D plot and perturbation plots provided information on the relationship between the variables and the responses. The model predicted 100 solutions with desirability (Supplementary Table S2), with parameters with the best desirability selected for the final chromatographic trial.
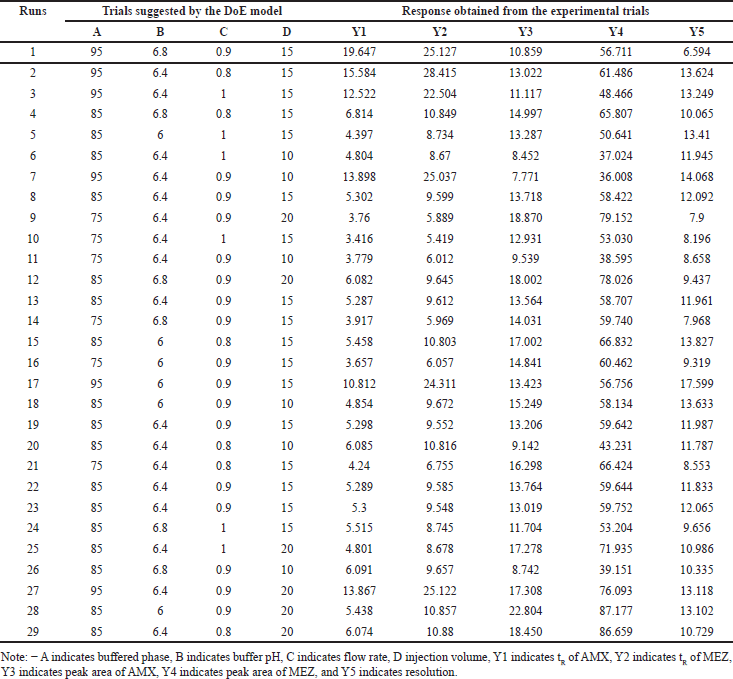 | Table 1. DoE recommended independent factors and their respected responses. [Click here to view] |
Method validation
The DoE-modeled method was validated as per the ICH Q2 (R2) guidelines [43]. A system suitability study was performed by injecting six AMX and MEZ replicates at 1 mg/ml concentrations and determining the Tailing factor (TF), number of theoretical plate (N), and tR. The method’s selectivity was evaluated by checking the interference of blank solvent, matrix, and excipients with the drug’s peak. The samples were injected in three replicates with blank diluent and analyzed for interferences at the tR of AMX and MEZ.
The linearity of the developed method was evaluated by plotting a standard curve for the AMX and MEZ between the peak area and drug concentration. The linearity range for AMX and MEZ was from 0.5 to 20 µg/ml. The linearity samples were injected in three replicates. The accuracy of the HPLC method was checked at 3 different concentration levels (80%, 100%, and 120%). The inter and intraday precision CVs % of the method were evaluated. The robustness of the developed method was checked by changing the chromatographic parameters slightly such as pH of the buffer 6.0 ± 0.2, temperature 25°C ± 1°C, flow rate 0.85 ± 0.05 ml/min, and injection volume 15 ± 1 µl. The limit of detection (LOD) (Eq. 1) and limit of quantification (LOQ) (Eq. 2) of the developed method were determined from the slope and standard deviation of the responses. Here, σ is the standard deviation of the response and S is the slope of the calibration curve.
LOD=3.3 σ/s (1)
LOQ=10 σ/s (2)
Preparation and evaluation of AMX and MEZ co-loaded pharmacosomes
Preparation of pharmacosomes
AMX and MEZ-loaded pharmacosomes were prepared by solvent evaporation method [44,45]. The solvent fumigation approach is frequently used because it may evenly distribute the lipid and drug components, encourage efficient complexation, and improve the final pharmacosomes stability. Controlled solvent evaporation made possible by this technique may result in increased drug loading and encapsulation effectiveness. Soya lecithin (80 mg) was weighed and dissolved in 60 ml DCM in a round bottom flask. AMX (50 mg) and MEZ (50 mg) were weighed, added to the above solution, and sonicated until complete dissolution. The solution was refluxed for 1 hour at an appropriate temperature of 37°C. The contents of the flask were evaporated at 35°C–40°C under vacuum in a rotary vacuum evaporator until the final traces of the solvent were removed. A vesicular suspension of pharmacosomes was created when the thin lipid layer that had developed at the bottom of the round-bottom flask was hydrated with 30 ml of phosphate buffer pH 7.4. The prepared pharmacosmes were lyophilized in a Labocon LFD-BT-101 Bench-top freeze dryer and stored in a desiccator for further studies.
Assessment of % EE of pharmacosomes
The % EE of the prepared pharmacosome formulation containing AMX and MEZ was assessed utilizing the validated DoE-modeled reverse phase HPLC technique. Centrifuged the vesicular suspension of pharmacosome suspended in 1 ml water at 12,000 rpm for 30 minutes and subjected the supernatant for HPLC analysis to obtain the amount of unentrapped drug (free drug). Methanol was added to the above solution to break down the lipid layer of pharmacosomes and determine the total amount of drugs present. The EE % will be evaluated by the following equation:
Drug release study
The release behavior of the developed pharmacosomes was evaluated using a USP type 2 dissolution apparatus. Dissolution of AMX and MEZ from the prepared pharmacosomes at pH 1.2 and 7.4 was evaluated at a temperature of 37°C. The pH values of 1.2 and 7.4 were selected for our study because H. pylori bacteria reside in the stomach, and it is essential for pharmacosomes to effectively release the drug in the gastrointestinal tract to ensure complete eradication of the infection. The acidic pH of 1.2 simulates the gastric environment, while pH 7.4 represents the more neutral conditions found in the intestines. We aim to optimize the formulation for targeted delivery and enhanced therapeutic efficacy against H. pylori infections by evaluating drug release at these specific pH levels. At predetermined time intervals, 2 ml of sample was withdrawn and analyzed for AMX and MEZ using the validated HPLC method. Taken at different time points. After the collection of samples, 2 ml of fresh media was added to the formulation’s dissolution unit to maintain the sink condition [46,47].
Forced degradation studies
The stress-induced degradation study aims to assess a drug’s stability in stressful conditions of formulation development. Acidic, alkaline, oxidative, thermal, and photolytic stresses were applied to the analytes. Forced degradation studies were conducted on pharmacosomes containing 1 mg/ml of AMX and MEZ. The DoE-modeled validated HPLC method was utilized to assess the drug concentration in the degradation samples. The assay was done in triplicate, and the percentage of deterioration was determined [20,48].
Acid hydrolysis of AMX and MEZ was evaluated at two different molar concentrations of HCl (0.1 N and 1 N). Degradation studies in an alkaline medium were checked and evaluated at two NaOH molar concentrations (0.1 N and 1 N). The oxidative stress-induced degradation study was evaluated using a 3% w/v H2O2 solution. The photolytic stability study was checked by exposing the prepared pharmacosomes to UV light for 24 hours. Thermal degradation study was evaluated in the oven at a temperature of 60°C for 24 hours [17,49].
Greenness of the developed method
The greenness of the analytical technique was evaluated utilizing the AGREE software (Analytical GREEnness Metric Approach and Software) [50]. This technique is designed to check the effect of the analytical method on the environment. This technique considers 12 factors, each given a score between 0 and 1, with higher numbers denoting a greener method.
RESULTS AND DISCUSSION
DoE-based modeling of the analytical method reduces the chances of trial failure and helps optimize chromatographic conditions, resulting in efficient separation of analytes. A photodiode array (PDA) detector was chosen for the separation considering the excellent absorption of AMX and MEZ at 228 and 320 nm, respectively. A Luna ODS C18 column was selected as the stationary phase based on the drug chemistry (Fig. 1) and considering the LogP values of 0.87 and −0.02 for AMX and MEZ, respectively. The ODS stationary phase is hydrophobic in nature, facilitating the hydrophobic interaction between the non-polar group of the drug and the stationary phase. The AMX has the hydrophobic phenyl ring, and MEZ has the hydrophobic aromatic ring [51] which interacts with the ODS stationary phase. The strong hydrophobic interaction between the hydrophobic groups of drug analytes and the ODS stationary phase results in the increased tR. An ODS C18 column was used to separate AMX and MEZ based on their respective LogP values of 0.87 and −0.02, which were determined by the literature and the chemistry of the medicines. Although AMX and MEZ are mostly polar, interactions between the hydrophobic phenyl ring of AMX and the nitrogen group (NO2) of MEZ with the hydrophobic ODS stationary phase are made possible by ODS’s intrinsic hydrophobicity. Because of this hydrophobic contact, AMX and MEZ are less effectively retained in the stationary phase and can elute more readily. Accordingly, the Luna ODS C18 column 250 × 4.6 mm, 5 µm column was employed in the preliminary OFAT trials. Phosphate buffer (10 mM), having a pH range between 6.2 and 8.2, was considered as a suitable choice for the aqueous phase considering the pKa values of AMX (7.1) and MEZ (2.8). This will help Initial OFAT trials using potassium dihydrogen phosphate buffer: methanol (80:20) at pH 6.5 produced a respectable resolution with tR of 2.6 minutes for AMX and 4.0 minutes for MEZ [52–57].
DoE-assisted optimization of HPLC method
Evaluation of risk assessment
A cause-effect assessment was performed using the Ishikawa fishbone illustration (Fig. 2), to understand the link between the analytical method parameters and the analytical outcomes. The purpose of the Ishikawa diagram is to pinpoint potential risk factors and underlying reasons that might affect how well an operation is performed. It shows the fundamental relationship between the critical method parameters and the critical analytical attributes. Utilizing a risk-based strategy based on the risk associated with each parameter, the critical variable was identified. The key factors for the screening were the flow rate, injection volume, wavelength, oven temperature, methanol: buffer ration, and buffer pH. Initial OFAT trials revealed that the buffer pH, buffer ratio, and mobile phase flow rate had a higher influence on the resolution, RT, and peak area.
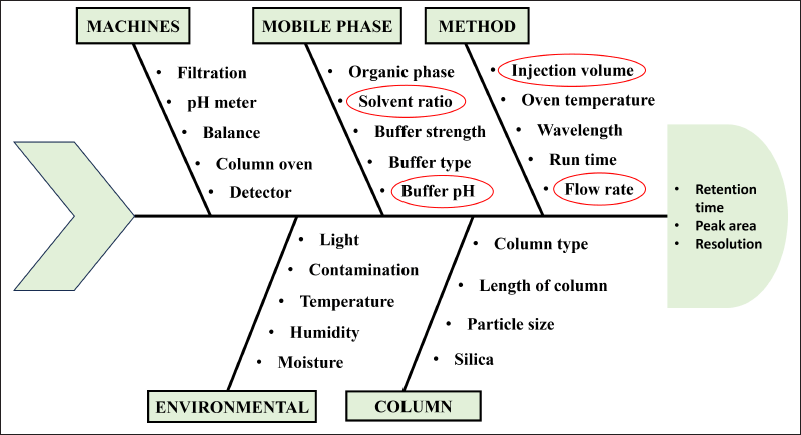 | Figure 2. Ishikawa fishbone diagram for the identification of possible risk factors. [Click here to view] |
BBD aided method optimization
The independent variables such as buffer ratio (A), buffer pH (B), flow rate (C), and injection volume (D) were optimized by DoE using the three-level BBD. The lower and higher limits for the variables were found using the OFAT technique. Accordingly, the range for the buffer ratio was from 75% to 90%, buffer pH was taken from 6.0 to 6.8, flow rate was taken from 0.8 to 1 ml/min, and injection volume was taken from 10 and 20 μl, respectively. Based on this, the DoE software proposed 29 possible runs for these independent factors. The suggested 29 HPLC runs were performed, and the responses were analyzed for the optimized chromatographic conditions. The responses chosen for optimization were tR of AMX (Y1), tR of MEZ (Y2), peak area of AMX (Y3), peak area of MEZ (Y4), and resolution (Y5). Suggested trial conditions and the corresponding responses obtained in the HPLC trials are shown in Table 1. An ANOVA analysis was performed on this data to understand the variables having a significant influence on the response (Table 2). Each ANOVA result in our study represents the relative contribution of each component and how those components contribute to the response variables’ overall variability. For instance, if a factor has a high F-value and a low p-value, it greatly impacts the result; if it has a high p-value, it does not significantly affect the findings. By analyzing these numbers, we may determine which variables are essential to improving our circumstances and which are less important. 3D plots and perturbation plots were generated using the DoE software between the individual responses and the four variables that significantly influenced the response. The influence of each independent variable on the chromatographic responses is described in the following section. The software generated 100 solutions based on the various permutations and combinations of the chromatographic conditions (variables) and the most optimal conditions were selected from the desirability plot.
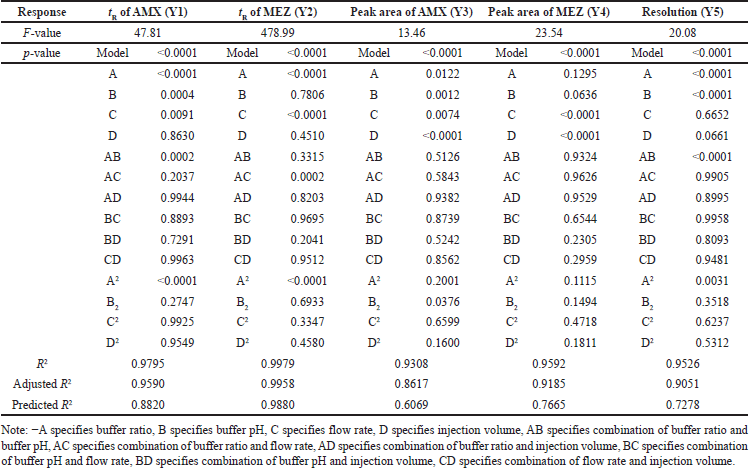 | Table 2. Outcomes for ANOVA of the BBD. [Click here to view] |
Influence of independent variables on tR of AMX (Y1)
The 3D (Fig. 3a) and perturbation (Fig. 4a) graphs were used to predict the impact of independent variables on the tR of AMX. The quadratic equation (Eq. 4) created by the ANOVA revealed that independent variables A and B have a significant impact on the tR of AMX. An increase in factors A and B increased the tR of AMX. The independent variable C has an opposite impact on the Rt of AMX, while the increase in C was found to reduce the tR of AMX. The independent variable D did not significantly affect the tR of AMX.
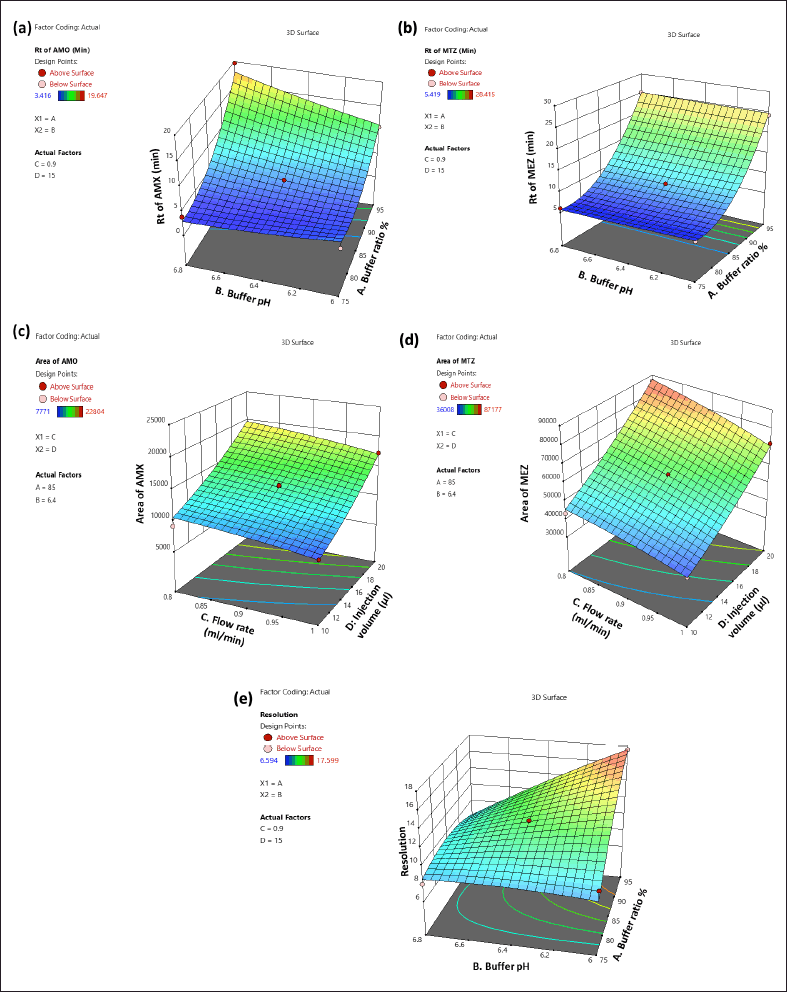 | Figure 3. 3D surface response graph showing the influence of independent variables on the tR of AMX (Y1), tR of MEZ (Y2), peak area of AMX (Y3), peak area of MEZ (Y4), and resolution (Y5). [Click here to view] |
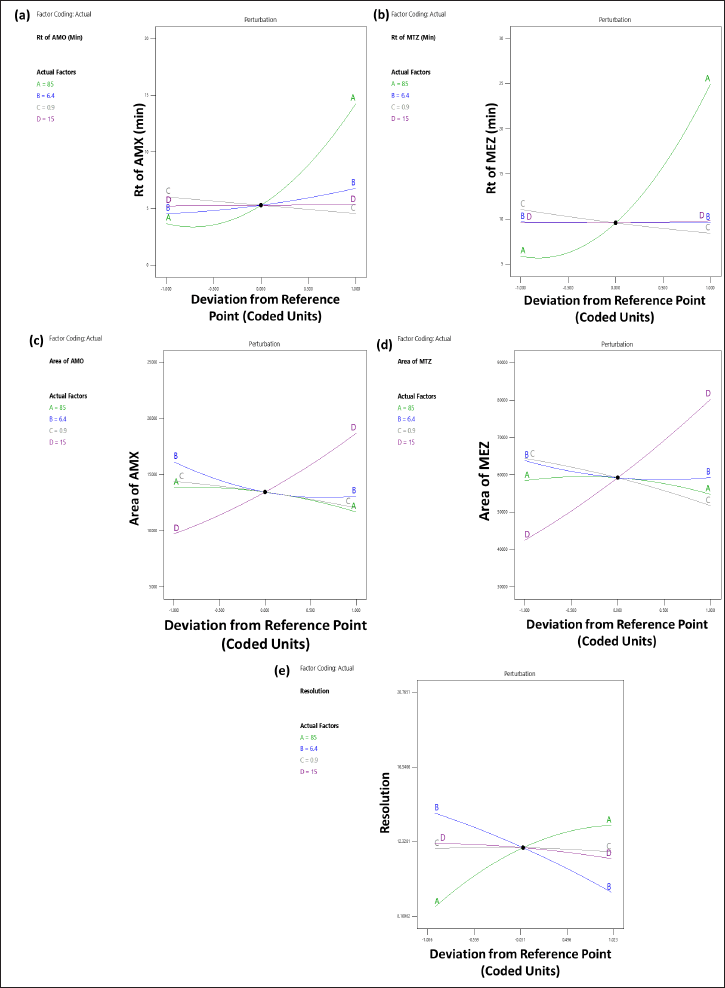 | Figure 4. Perturbation plot depicting the impact of independent factors: (a) on the tR of AMX (Y1); (b) tR of MEZ (Y2); (c) peak area of AMX (Y3); (d) peak area of MEZ (Y4); and (e) resolution (Y5). [Click here to view] |
Y1 = + 5.2952 + 5.29675 × A + 1.12083 × B – 0.733333 × C + 0.0425833 × D + 2.14375 × AB – 0.5595 × AC – 0.003 × AD – 0.0595 × BC – 0.14825 × BD + 0.002 × CD + 3.67677 × A2 + 0.37465 × B2 + 0.00315 × C2 – 0.018975 × D2 (4)
Influence of independent variables on Rt of MEZ (Y2)
The 3D (Fig. 3b) and perturbation (Fig. 4b) graph were used to predict the impact of independent variables on the tR of MEZ. The quadratic equation (Eq. 5) generated by the ANOVA showed that A and C significantly affect the tR of MEZ. An increase in independent variable A reflected an increase tR of MEZ, while an increase in independent variable C decreased the tR of MEZ. The independent variables B and D did not significantly affect the tR of MEZ.
Y2 = + 9.5792 + 9.53458 × A – 0.0368333 × B – 1.314 × C + 0.100583 × D + 0.226 × AB – 1.14375 × AC + 0.052 × AD – 0.00875 × BC – 0.29925 × BD – 0.014 × CD + 5.8449 × A2 + 0.071025 × B2 + 0.176275 × C2 + 0.13465 × D2 (5)
Influence of independent factors on peak area of AMX (Y3)
The peak area of AMX was significantly affected by the independent variables C and D as can be seen in the 3D (Fig. 3c) and perturbation (Fig. 4c) graphs. The quadratic equation (Eq. 6) generated by the ANOVA showed that independent variables C and D significantly impact the peak area of AMX. While independent variables A and B has less significant effect on the peak area of AMX. Theoretically, an increase in injection volume increases the number of moles of analyte available to emit a signal, which is associated with an increase in the area of AMX. Similarly, an increase in C decreased the analyte’s interaction time with the stationary phase, which was associated with a slight decline in the response area of AMX.
Y3 = + 13454.2 – 1084.17 × A – 1522.58 × B – 1178.5 × C + 4484.75 × D – 438.5 × AB + 365.5 × AC + 51.5 × AD + 105.5 × BC + 426.25 × BD – 120.5 × CD – 689.142 * A2 + 1177.23 × B2 – 230.392 × C2 + 760.483 × D2 (6)
Influence of independent factor on peak area of MEZ (Y4)
The quadratic equation (Eq. 7) generated by the ANOVA showed that independent factors C and D significantly affect the area of MEZ. The independent variables A and B have no significant effect on the area of MEZ. The 3D (Fig. 3d) and perturbation (Fig. 4d) graph showed that the peak area of MEZ was found to increase with an increase in D and a decrease in C.
Y4 = + 59233.4 – 1823.58 × A – 2280.25 × B – 6344.92 × C + 18908.3 × D + 169.25 × AB + 93.5 × AC – 118 × AD + 897 × BC + 2458 × BD – 2129.25 × CD – 2615.66 × A2 + 2349.09 × B2 – 1138.66 × C2 + 2167.09 × D2 (7)
Influence of independent factors on resolution (Y5)
The resolution is the distance between the two nearby peaks. The generated ANOVA quadratic equation (Eq. 8) showed the effect of independent variables on the resolution. The 3D (Fig. 3e) and perturbation (Fig. 4e) graph showed that the independent variables A and B significantly affect the resolution. In contrast, the independent variables C and D have no significant effect on the resolution. An increase in A and a decrease in B lead to increased resolution between the peaks.
Y5 = + 11.9876 + 2.30483 × A – 2.23625 × B – 0.09525 × C – 0.4295 × D – 2.4135 × AB – 0.0045 × AC – 0.048 × AD + 0.002 × BC – 0.09175 × BD + 0.02475 × CD – 1.04463 × A2 – 0.282258 × B2 – 0.147008 × C2 – 0.188133 × D2 (8)
Desirability
The chromatographic parameters with a desirability of 0.932 were confirmed as optimal chromatographic parameters, based on the desirability graph generated (Fig. 5). The most optimum conditions suggested by the desirability were as follows. Mobile phase ratio: methanol: potassium dihydrogen phosphate buffer (20:80) in isocratic mode; pH of the mobile phase 6.0; flow rate: 0.9 ml/min; injection volume: 10 µl; column oven temperature: 25°C. The above-suggested conditions were tried on the Phenomenex Luna C18 column (250 × 4.6 mm, 5 µm particle size) with the detector wavelength set at 228 nm for AMX and 320 nm for MEZ. The chromatogram obtained under the above condition is shown in Figure 5. The reliability and reproducibility of the DoE-modeled method were further confirmed by performing full validation as per the ICH guideline.
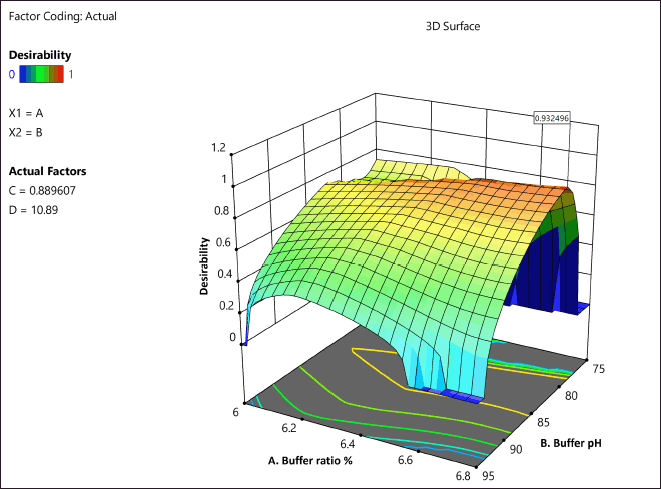 | Figure 5. Desirability plot depicting the optimized conditions. [Click here to view] |
Method validation
Validation of the analytical method assures that the method is accurate, reproducible, and fit for the purpose. Results of the validation of the developed method are given in Table 3. The results of the system suitability evaluation showed good resolution, TF, and N more than 2,000, ensuring that the analytical system is functioning efficiently. A blank chromatogram of the formulation showed no interfering peaks of the excipients or the degradation products at the tR of AMX and MEZ demonstrating the selectivity of the method (Fig. 6). Linearity in the 0.5–20 µg/ml range was obtained for AMX and MEZ with R2 value ? 0.999. The linearity equation for the AMX was y= 8960.6x – 909.13 and for MEZ was y= 22180x – 1108.7. The calibration curve of AMX and MEZ is shown in Figure S1.
 | Table 3. Validation data of the optimized analytical method. [Click here to view] |
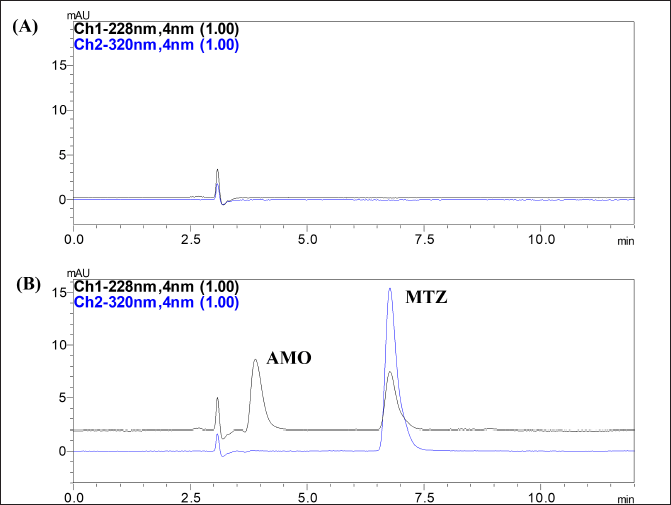 | Figure 6. Chromatogram obtained at optimized conditions (A) Chromatogram of blank formulation; (B) Chromatogram of formulation co-loaded AMX and MEZ. [Click here to view] |
The accuracy evaluations of the developed method showed recovery results within 100% ± 2% at all three concentration levels demonstrating the accuracy of the method. The precision % CV of < 2% seen for intra and inter-day precision studies shows that the method is highly reproducible for AMX and MEZ. The method’s LOD and LOQ were 105 and 225 ng/ml, respectively, for AMX, while the values were 65 and 110 ng/ml for MEZ. Evaluation of the robustness of the method showed that slight variations to the temperature, injection volume, wavelength, pH of the buffer, and flow rate do not influence the separation efficiency. Robustness data are provided in Supplementary Table S1. The validation study confirms the method’s suitability for quantifying these drugs from their formulations.
Application of the method for evaluation the developed pharmacosomes
EE % of pharmacosomes using the validated method
A critical formulation metric for assessing the efficiency of novel drug delivery systems is the evaluation of EE %. The capacity of a formulation to encapsulate the medicine within the carrier system is referred to as EE %. During formulation development, it is essential to identify the conditions that cause the highest entrapment of the drug. This determination is crucial for formulations such as mucoadhesive beads, liposomes, nanoparticles, and microspheres. We tried different ratios of soy lecithin and DCM to obtain maximum entrapment efficiency (Table 4, Fig. 7). As can be seen in the table and figure, we observed that the % entrapment is increasing with an increase in the ratio of Soy lecithin. However, the particle size of the pharmacosome also was found to increase with the increase in the ratio. The increase in the particle size was more prominent after the ratio of 130: 60. Accordingly, the final optimized pharmacosome is having a EE % of 85.39 % (AMX) and 82.55% (MEZ).
 | Table 4. Results of % EE of pharmacosomes co-loaded with AMX and MEZ. [Click here to view] |
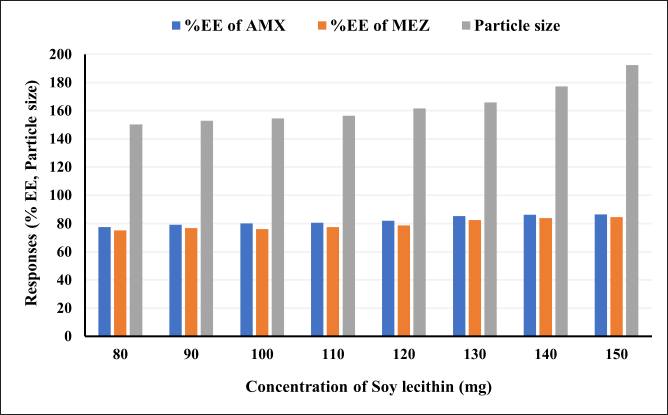 | Figure 7. An illustration of the effect of increasing the ratio of soya lecithin on the entrapment efficiency and particle size. [Click here to view] |
In-vitro drug release from the pharmacosomes
The developed method evaluated the drug release studies from the AMX and MEZ co-loaded pharmacosomes. The release studies were conducted at pH 1.2 and 7.4. Samples were collected at the following time points: 0.25, 0.5, 1, 2, 3, 4, 5, 6, 7, 8, and 10 hours. The results showed that the pharmacosomes were stable at both pH levels tested. Complete release of both drugs were observed by 6 hours at all the pH levels studied. There was a burst release of around 30% of the drug within 30 minutes, followed by the linear release of the drug for up to 6 hours, after which no release was observed, as can be seen in Figure 8A and B. The release profile showed that the highest release obtained from pharmacosomes was 89.62% ± 3.04% of AMX and 89.84% ± 2.01% of MEZ at pH 1.2, while at pH of 7.4, they were 83.01% ± 3.29% of AMX and 87.69% ± 3.59% of MEZ.
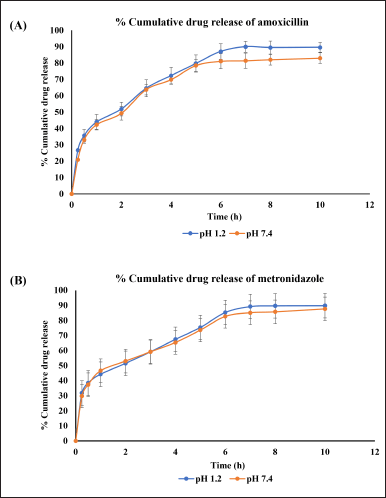 | Figure 8. An illustration of % cumulative drug release of drugs at pH 1.2 and pH 7.4 (A) AMX and (B) MEZ. [Click here to view] |
Forced degradation study results
A degradation study was conducted to assess the stability of AMX and MEZ throughout formulation development. Figure 9 demonstrates the whole degradation analysis done as part of the study under various stress situations. AMX was shown to be degraded by more than 72% in strongly acidic conditions (1 N HCl); however, the degradation was less than 10% under moderately acidic conditions (0.1 N HCl). Conversely, in alkaline conditions and on exposure to sunlight, degradation of AMX was negligible. The degradation of MEZ was 20% in mildly alkaline (0.1 N NaOH) and 59% in strongly alkaline (1 N NaOH) conditions. The degradation of MEZ by exposure to sunlight was less than 20%. The study showed that the drug will be stable at conditions employed for its formulation, which does not involve higher acidic and alkaline conditions. The pictorial representation of the chromatogram and peak purity graph of AMX and MEZ is shown in Figures S2 and S3.
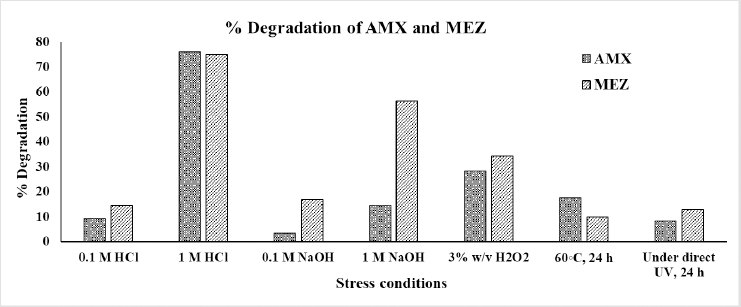 | Figure 9. Forced degradation study results for AMX and MEZ illustrated in a column chart that displays the percentage of degradation under each condition. [Click here to view] |
Greenness of analytical method
The aim of green analytical chemistry (GAC) is to evaluate the impact of analytical procedures on the atmosphere, worker safety, and health is the aim of GAC, mainly when the procedure requires utilizing organic solvents in the mobile phase. In recent years, there has been a tremendous increase in interest in GAC, making it feasible to rate the greenness of various analytical approaches utilizing a range of green evaluation tools. Here we would like to highlight that the solvents used in this investigation were chosen with care to reduce their negative effects on the environment while preserving analytical effectiveness. To minimize the use of improved, giving preference to aqueous-based systems and eco-friendly substitutes whenever feasible. By minimizing solvent waste and guaranteeing safer laboratory procedures, this is consistent with the tenets of GAC. Furthermore, to give a better picture of the sustainability of the process, we have now given solvent consumption in ml each run. The method’s solvent consumption efficacy is demonstrated by the total volume of mobile phase utilized each run, which is 10.8 ml to further increase the method’s environmental friendliness, efforts were undertaken to reduce solvent usage without sacrificing chromatographic performance. Using the AGREE program, we created an illustration (Fig. 10) that showed how environmentally friendly, the AGREE score of 0.66 showed that the developed method was environment friendly, the developed RP-HPLC technique for the measurement of AMX and MEZ was determined to be environmentally friendly.
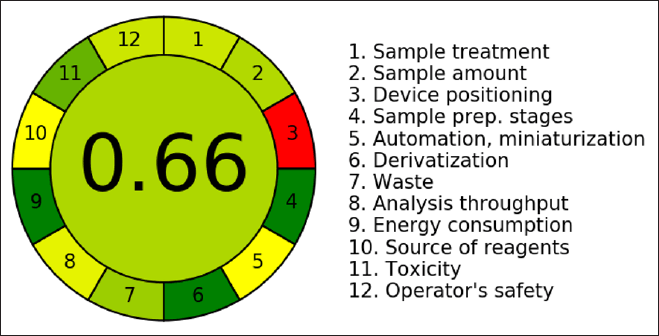 | Figure 10. Pictorial illustration showing the greenness of the analytical method. [Click here to view] |
CONCLUSION
The three-level BBD was used to create a reliable HPLC-PDA analytical method for simultaneously measuring AMX and MEZ from its formulations. To clearly illustrate the effect of this method, the DoE tool assisted in understanding the effects of the interactions between the independent factors on the results of chromatographic separation. The model-predicted method was found to be linear, precise, and accurate. It demonstrated selectivity for the AMX and MEZ from the excipients of the formulation and degradation products. The pharmacosomes are amphiphilic complexes loaded with hydrophilic and lipophilic drugs, which improves their solubility and stability. The unique characteristics of pharmocasomes such as small size, high drug entrapment efficiency, and amphilicity permit them got better interact with biological membranes, facilitating drug absorption. One of the significant advantages of pharmacosomes is their ability to improve the dissolution and permeation of drugs, leading to increased bioavailability. Adding more lecithin increases efficiency, but it can also have an impact on formula stability and particle size. Larger particle sizes may result from enhanced vesicular aggregation and bilayer formulation at higher lecithin concentrations. In particular, large particles may slow down the pace at which drugs are absorbed in biological systems, which might impact drug absorption. Because smaller particles dissolve more rapidly and are absorbed more efficiently in the gastrointestinal tract, this is especially important for oral formulation. The developed method was utilized to calculate the formulation’s in-vitro drug release and EE %, which allowed for the optimization of the excipient ratio to provide the maximum EE % and required drug release. The method was also applied to evaluate the % of degradation successfully. The model-predicted method is also very ecofriendly. The method can be applied further to analyze AMX and MEZ, commonly used as first-line treatment in H. pylori infection in other combination therapies in clinical settings. Additionally, investigating the effectiveness of these drugs in different formulations such as nanoparticles or sustained-release forms could provide insights into overcoming antibiotic resistance. In conclusion, we have developed and fully validated an HPLC-based analytical technique for the quantification of AMX and MEZ from its formulations. The method could be used to assess drug loading, EE %, release profile, and drug assay from several formulations of AMX and MEZ. The developed method is eco-friendly, economical, robust, accurate, and more precise than the previous method.
LIST OF ABBREVIATIONS
AMX, Amoxicillin; BBD, Box-Behnken design; CAAs, Critical analytical attributes; CCD, Central composite design; CMPs, Critical method parameters; DoE, Design of experiment; EE %, % Entrapment efficiency; GAC, Green analytical chemistry; HPLC, High Performance Liquid chromatography; H. pylori, Helicobacter pylori; LOD, Limit of detection; LOQ, Limit of quantification; MEZ, Metronidazole; N, Number of theoretical plate; OFAT, One factor at a time; PDA, Photodiode array; TF, Tailing fator; tR, Retention time.
ACKNOWLEDGMENT
The authors are also grateful to Manipal Academy of Higher Education, Manipal, Karnataka, for providing the facilities. The authors are thankful for Biorender.com, a figure-making tool. The authors wish to acknowledge the Indian Council of Medical Research for the fellowship granted to Mr Ashutosh Gupta under the ICMR SRF program with file no. File no. 3/2/2/16/2022-NCD-III.
AUTHOR CONTRIBUTIONS
All authors made substantial contributions to the conception and design, acquisition of data, or analysis and interpretation of data; took part in drafting the article or revising it critically for important intellectual content; agreed to submit to the current journal; gave final approval of the version to be published; and agree to be accountable for all aspects of the work. All the authors are eligible to be an author as per the International Committee of Medical Journal Editors (ICMJE) requirements/guidelines.
FINANCIAL SUPPORT
The study described in this article is a part of the project funded by the Indian Council of Medical Research (ICMR) under the extra mural ADHOC program with file no. OMI/10/2022/ECD dated 10.02.2023 titled “A pilot study to evaluate the novel GRDDS system for treatment of H. pylori induced gastric ulcer”.
CONFLICTS OF INTEREST
The authors report no financial or any other conflicts of interest in this work.
ETHICAL APPROVAL
This study does not involve experiments on animals or human subjects.
DATA AVAILABILITY
All data generated and analyzed are included in this research article.
PUBLISHER’S NOTE
All claims expressed in this article are solely those of the authors and do not necessarily represent those of the publisher, the editors and the reviewers. This journal remains neutral with regard to jurisdictional claims in published institutional affiliation.
USE OF ARTIFICIAL INTELLIGENCE (AI)-ASSISTED TECHNOLOGY
The authors declares that they have not used artificial intelligence (AI)-tools for writing and editing of the manuscript, and no images were manipulated using AI.
REFERENCES
1. Ansari S, Yamaoka Y. Animal models and Helicobacter pylori infection. J Clin Med. 2022 May 31;11(11):3141.
2. Narayanan M, Reddy KM, Marsicano E. Peptic ulcer disease and Helicobacter pylori infection. Mo Med. 2018;115(3):219–24.
3. Poh AR, O’Donoghue RJJ, Ernst M, Putoczki TL. Mouse models for gastric cancer: matching models to biological questions. J Gastroenterol Hepatol. 2016 Jul;31(7):1257–72.
4. Tshibangu-Kabamba E, Yamaoka Y. Helicobacter pylori infection and antibiotic resistance—from biology to clinical implications. Nat Rev Gastroenterol Hepatol. 2021 Sep;18(9):613–29.
5. Gupta S, Saha M, Singh R, Ahmed SB, Asati V. Multistage in silico approach to identify novel quinoline derivatives as potential c-kit kinase inhibitors. J Biomol Struct Dyn. 2024;0(0):1–18.
6. Saha M, Gupta S, Gupta A, Patel R, Rajora AD, Almehizia AA, et al. Development of novel hydroxy amide-based HDAC1 inhibitors: integrated pharmacophore modelling, 3D-QSAR, and virtual screening studies. ChemistrySelect. 2024;9(46):e202404466.
7. Tsay FW, Hsu PI. H. pylori infection and extra-gastroduodenal diseases. J Biomed Sci. 2018 Aug 29;25(1):65.
8. Gupta A, Shetty S, Mutalik S, Chandrashekar HR, Nandakumar K, Mathew EM, et al. Treatment of H. pylori infection and gastric ulcer: need for novel pharmaceutical formulation. Heliyon. 2023 Sep 24;9(10):e20406.
9. Duan M, Li Y, Liu J, Zhang W, Dong Y, Han Z, et al. Transmission routes and patterns of Helicobacter pylori. Helicobacter. 2023;28(1):e12945.
10. de Brito BB, da Silva FAF, Soares AS, Pereira VA, Santos MLC, Sampaio MM, et al. Pathogenesis and clinical management of Helicobacter pylori gastric infection. World J Gastroenterol. 2019 Oct 7;25(37):5578–89.
11. Kao CY, Sheu BS, Wu JJ. Helicobacter pylori infection: an overview of bacterial virulence factors and pathogenesis. Biomed J. 2016;39(1):14–23.
12. Chmiela M, Kupcinskas J. Review: pathogenesis of Helicobacter pylori infection. Helicobacter. 2019;24(S1):1–5.
13. Verma A, Dubey J, Hegde RR, Rastogi V, Pandit JK. Helicobacter pylori: past, current and future treatment strategies with gastroretentive drug delivery systems. J Drug Target. 2016;24(10):897–915.
14. Lee YC, Dore MP, Graham DY. Diagnosis and treatment of Helicobacter pylori infection. Annu Rev Med. 2022 Jan 27;73:183–95.
15. Grosso R, de-Paz MV. Scope and limitations of current antibiotic therapies against Helicobacter pylori: reviewing amoxicillin gastroretentive formulations. Pharmaceutics. 2022 Jun 24;14(7):1340.
16. Miri AH, Kamankesh M, Llopis-Lorente A, Liu C, Wacker MG, Haririan I, et al. The potential use of antibiotics against Helicobacter pylori infection: biopharmaceutical implications. Front Pharmacol. 2022 Jun 27;13:917184.
17. Saha M, Gupta A, Shetty S, Mutalik S, Nandakumar K, Raghu Chandrashekar H, et al. DoE-aided optimization of RP-HPLC method for simultaneous estimation of amoxicillin and tinidazole loaded mucoadhesive GRDDS formulation for the treatment of H. pylori. Chromatographia [Internet]. 2024 Jul 2 [cited 2024 Jul 5];87(9):533–48. https://doi.org/10.1007/s10337-024-04346-8
18. Kim SY, Choi DJ, Chung JW. Antibiotic treatment for Helicobacter pylori: is the end coming? World J Gastrointest Pharmacol Ther. 2015 Nov 6;6(4):183–98.
19. Shiotani A, Lu H, Dore MP, Graham DY. Treating Helicobacter pylori effectively while minimizing misuse of antibiotics. CCJM. 2017 Apr 1;84(4):310–8.
20. Gupta A, Navti PD, Mutalik S, Saha M, Moorkoth S. DoE guided development of an HPLC method for evaluation of amoxicillin and metronidazole co-loaded mucoadhesive GRDDS formulation for H. pylori eradication. Chromatographia [Internet]. 2023 Oct 28 [cited 2023 Oct 29];86(11–12):3. https://doi.org/10.1007/s10337-023-04290-z
21. Bacaks?z EG, Hakim GD, Y?ld?z C, Akar H. Which is the best choice for Helicobacter pylori eradication? Dual therapy or quadruple therapy? Prz Gastroenterol. 2022;17(2):138–45.
22. Savarino V, Neri M, Vigneri S. PPI-based triple therapy in the eradication of H. pylori infection. Gastroenterology. 1999 Sep 1;117(3):746–7.
23. Erah PO, Goddard AF, Barrett DA, Shaw PN, Spiller RC. The stability of amoxycillin, clarithromycin and metronidazole in gastric juice: relevance to the treatment of Helicobacter pylori infection. J Antimicrob Chemother. 1997;39(1):5–12.
24. Gupta A, Nishchaya K, Saha M, Naik GARR, Yadav S, Srivastava S, et al. Recent advancements in nanoconstructs for the theranostics applications for triple negative breast cancer. J Drug Delive Sci Technol. 2024 Mar 1;93:105401.
25. Aravindan A, Gupta A, Moorkoth S, Dhas N. Implications of nanotherapeutic advancements to leverage multi-drug resistant breast cancer: the state-of-the-art review. J Drug Deliv Sci Technol. 2024 Oct 1;100:106007.
26. Gupta A, Kulkarni S, Soman S, Saha M, Kulkarni J, Rana K, et al. Breaking barriers in cancer management: the promising role of microsphere conjugates in cancer diagnosis and therapy. Int J Pharm. 2024 Nov 15;665:124687.
27. Pandita A, Sharma P. Pharmacosomes: an emerging novel vesicular drug delivery system for poorly soluble synthetic and herbal drugs. ISRN Pharm. 2013 Sep 9;2013:348186.
28. Hoffman JS. Pharmacological therapy of Helicobacter pylori infection. Semin Gastrointest Dis. 1997 Jul;8(3):156–63.
29. Francesco VD. Helicobacter pylori therapy: present and future. World J Gastrointest Pharmacol Ther. 2012;3(4):68.
30. Gidde ND, Raut ID, Nitalikar MM, Mohite SK, Magdum CS. Pharmacosomes as drug delivery system: an overview. Asian J Pharm Res. 2021 May 11;11(2):122–7.
31. Kudarha R, Colaco V, Gupta A, Kulkarni S, Soman S, Kulkarni J, et al. Recent advancements in selenium nanoconstructs as a potential carrier in cancer therapy. Nano-Struct Nano-Objects. 2024 Dec 1;40:101399.
32. Gopireddy RR, Maruthapillai A, Devikala S, Tamilselvi M, Selvi JA, Mahapatra S. DoE approach: a validated stability indicating RP-HPLC method development for the separation of diasteromeric analogs and process impurities of carfilzomib. Mater Today Proc. 2019 Jan 1;14:514–31.
33. Gupta A, Kossambe RV, Moorkoth S. Box-behnken design assisted eco-friendly RP-HPLC-PDA method for the quantification of paclitaxel: application to evaluate the solubility of paclitaxel-cyclodextrin complex. Int J Appl Pharm. 2024 Nov 7;16(6):305–15.
34. Jankovic A, Chaudhary G, Goia F. Designing the design of experiments (DOE)—an investigation on the influence of different factorial designs on the characterization of complex systems. Energy Build. 2021 Nov 1;250:111298.
35. Gupta A, Shetty S, Mutalik S, Navti PD, Saha M, Moorkoth S. Box-Behnken guided development of an ecofriendly RP-HPLC analytical method for simultaneous quantification of pantoprazole sodium and piperine co-loaded mucoadhesive GRDDS formulation for H. pylori eradication. J App Pharm Sci [Internet]. 2024 Jun 14 [cited 2024 Jun 18];14(09):098–110. Available from: https://japsonline.com/abstract.php?article_id=4318&sts=2
36. Constable DJC, Jimenez-Gonzalez C, Henderson RK. Perspective on solvent use in the pharmaceutical industry. Org Process Res Dev. 2007 Jan 1;11(1):133–7.
37. Tome T, Žigart N, ?asar Z, Obreza A. Development and optimization of liquid chromatography analytical methods by using AQbD principles: overview and recent advances. Org Process Res Dev. 2019 Sep 20;23(9):1784–802.
38. Gupta A, Rachana SP, Moorkoth S, Dhas N. Central composite design aided optimization and validation of developed an eco-friendly HPLC method for the quantification of lenalidomide loaded mesoporous silica nanoparticles. J App Pharm Sci. 2024 Nov 25;15,(1):089–101.
39. Sar?salt?k Ya??n D, Arslantürk Bingül A, Karaküçük A, Teksin Z?. Development and validation of an HPLC method using an experimental design for analysis of amlodipine Besylate and Enalapril maleate in a fixed-dose combination. Turk J Pharm Sci. 2021 Jun 18;18(3):306–18.
40. Tomikj M, Božinovska M, Anevska-Stojanovska N, Lazova J, Acevska J, Brezovska K, et al. Sustainable and white HPLC method for simultaneous determination of amlodipine and atorvastatin in film-coated tablet. Green Anal Chem. 2024 Mar 1;8:100103.
41. Mutalik SP, Mullick P, Pandey A, Kulkarni SS, Mutalik S. Box–Behnken design aided optimization and validation of developed reverse phase HPLC analytical method for simultaneous quantification of dolutegravir sodium and lamivudine co-loaded in nano-liposomes. J Sep Sci. 2021 Aug;44(15):2917–31.
42. Naik S, Mullick P, Mutalik SP, Hegde AR, Lewis SA, Bhat K, et al. Full factorial design for development and validation of a atability-indicating RP-HPLC method for the estimation of Timolol maleate in surfactant-based elastic nano-vesicular systems. J Chromatogr Sci. 2022 Jul 12;60(6):584–94.
43. ICH guideline. Research C for DE and. Q2(R1) Validation of analytical procedures: text and methodology guidance for industry [Internet]. Rockville, MD: FDA; 2021 [cited 2024 Aug 23]. Available from: URL: https://www.fda.gov/media/152208/download
44. Semalty A, Semalty M, Rawat BS, Singh D, Rawat MSM. Development and evaluation of pharmacosomes of aceclofenac. Indian J Pharm Sci. 2010;72(5):576–81.
45. Rana P, Mahajan A, Singh D, Singh K. Pharmacosomes: a versatile delivery system for problematic molecules. Curr Nanomed. 2021 Jul 1;11(2):82-90.
46. Iqbal S, Zaman M, Waqar MA, Sarwar HS, Jamshaid M. Vesicular approach of cubosomes, its components, preparation techniques, evaluation and their appraisal for targeting cancer cells. J Liposome Res. 2024 Apr 2;34(2):368–84.
47. Bhinge SD, Kamalakar SP, Randive DS, Bhutkar MA, Patil KS, Merekar AN, et al. Development and characterization of stable proanthocyanidin-loaded PLAROsomes as a potential drug carrier system for augmenting anticancer activity. Eur J Lipid Sci Technol. 2024;126(6):2300218.
48. Marques SM, Salwa, Kumar L. Quality-by-design-based development of an eco-friendly HPLC method for the estimation of nisoldipine in nanoformulations: forced degradation studies and in-vitro release studies. Sustain Chem Pharm. 2023 Dec 1;36:101254.
49. Miriam Marques S, Shirodkar RK, Kumar L. Analytical ‘Quality-by-Design’ paradigm in development of a RP-HPLC method for the estimation of cilnidipine in nanoformulations: forced degradation studies and mathematical modelling of in-vitro release studies. Microchem J. 2023 Oct 1;193:109124.
50. Pena-Pereira F, Wojnowski W, Tobiszewski M. AGREE—analytical GREEnness metric approach and software. Anal Chem. 2020 Jul 21;92(14):10076–82.
51. Dingsdag SA, Hunter N. Metronidazole: an update on metabolism, structure–cytotoxicity and resistance mechanisms. J Antimicrob Chemother. 2018 Feb 1;73(2):265–79.
52. Hoizey G, Lamiable D, Frances C, Trenque T, Kaltenbach M, Denis J, et al. Simultaneous determination of amoxicillin and clavulanic acid in human plasma by HPLC with UV detection. J Pharm Biomed Anal. 2002 Oct 15;30(3):661–6.
53. Batrawi N, Wahdan S, Al-Rimawi F. A validated stability-indicating HPLC method for simultaneous determination of amoxicillin and enrofloxacin combination in an injectable suspension. Sci Pharm. 2017;85(1):6.
54. Bellur Atici E, Yazar Y, A?ta? Ç, Ridvano?lu N, Karl??a B. Development and validation of stability indicating HPLC methods for related substances and assay analyses of amoxicillin and potassium clavulanate mixtures. J Pharm Biomed Anal. 2017 Mar 20;136:1–9.
55. Dorn C, Kratzer A, Schießer S, Kees F, Wrigge H, Simon P. Determination of total or free cefazolin and metronidazole in human plasma or interstitial fluid by HPLC-UV for pharmacokinetic studies in man. J Chromatogr B. 2019 Jun 15;1118–1119:51–4.
56. Maher HM, Youssef RM, Khalil RH, El-Bahr SM. Simultaneous multiresidue determination of metronidazole and spiramycin in fish muscle using high performance liquid chromatography with UV detection. J Chromatogr B. 2008 Dec 15;876(2):175–81.
57. Wang Y, Zhang P, Jiang N, Gong X, Meng L, Wang D, et al. Simultaneous quantification of metronidazole, tinidazole, ornidazole and morinidazole in human saliva. J Chromatogr B. 2012 Jun 15;899:27–30.