
INTRODUCTION
Tacrolimus (TAC) is a calcineurin inhibitor that prevents transplanted organ rejection and is used in the treatment of certain autoimmune diseases treatment. TAC inhibits calcineurin, which is required for interleukin-2 production, an important factor for the proliferation and differentiation of T cells [1]. Although TAC is effective as an immunosuppressant, high-dose or prolonged use can induce tubulointerstitial fibrosis (TIF) through many pathways, including activation of the TGF-β signaling pathway [2]. Increased levels of fibrotic markers such as fibronectin, Vimentin, and α-smooth muscle actin are the result of epithelial-mesenchymal transition (EMT) promoted by TAC treatment. TGF-β1 signaling mediates EMT, which in turn activates the Smad pathway [1,2]. Moreover, TGF-β receptor activation mediates fibroblast-to-myofibroblast transition, leading to increased deposition of extracellular matrix (ECM), collagen, and connective tissue growth factor (CTGF) in renal tissues [3]. In addition, in TAC-induced TIF, activation of P38 Mitogen-Activated Protein Kinase (MAPK) and Extracellular Signal-Regulated Kinase (ERK) pathways has been observed, which primarily contributes to EMT and consequently TIF. Inhibition of these pathways has been shown to confer protection against TAC-induced renal TIF [1]. The cysteine-X- cysteine Chemokine chemokine receptor type 2 (CXCR2) mediates TAC-induced TIF through increased its expression and increased ligands, such as CXCL1, CXCL2, and CXCL3, leading to the recruitment of inflammatory cells to the tubulointerstitial space [4].
FX is a key component of the coagulation cascade and serves as a pivot point between the intrinsic and extrinsic pathways, and its activation generates thrombin, which in turn forms fibrin. In addition to its role in hemostasis, factor Xa (FXa) contributes to inflammation and fibrosis, including renal fibrosis, through the activation of protease-activated receptors (PARs), which promote inflammation, accumulation of ECM, and finally fibrosis [5,6]. Calcineurin inhibitors also may activate the coagulation system, resulting in a pro-coagulant state [7]. For instance, FX inhibitors like edoxaban have been shown to reduce fibrosis in a chronic kidney disease model, including subtotal nephrectomy [8] and a renal injury model of unilateral ureteral obstruction in mice [6].
After TAC treatment in renal transplantation, certain coagulation abnormalities, including thrombotic microangiopathy, have been reported [9]. However, the possible link between the coagulation system activation and TAC-induced renal TIF remains poorly understood. The aim of the present study is to explore the potential role of FX activation in TAC-induced renal TIF and to assess the possible protective role of the indirect FXa inhibitors, rivaroxaban (RIV), in TAC-induced TIF.
MATERIALS AND METHODS
Chemicals and antibodies
TAC was purchased from Sigma-Aldrich (MA, USA). RIV was obtained from Boehringer Ingelheim (Ingelheim am Rhein, Germany). Monoclonal mouse antibodies for fibrinogen, p-AKT, TGF-β and fibronectin (with extra domain-A, ED-A), besides rabbit polyclonal antibody for PI3K, were bought from Santa Cruz Biotechnology (TX, USA). Fluoromount G® was attained from DAKO (CA, USA). Goat anti-mouse Alexa Fluor 488 and Goat anti-rabbit Cy3 were obtained from Invitrogen (CA, USA).
Animals
BALB/c male albino mice with 23–30 g weight were supplied from the College of Pharmacy animal house, Qassim University, Saudi Arabia. Mice were kept for 5 days prior to the start of the experiment to accommodate in a temperature range from 23°C to 25°C. The humidity was adjusted at 55% with a 12-hour light on/off cycle. Forty animals were randomly classified into four sets, 10 mice per group. The control was treated with saline p.o for 14 days. RIV group was treated every day with RIV orally 3 mg/kg for 14 days as mentioned in the study of Wagner et al. [10]. As described by Reagan-Shaw et al. [11], the human equivalent dose for a 3 mg/kg/day dose of RIV in mice is about 0.24 mg/kg/day in humans, which is closely aligned with the standard 15–20 mg/day therapeutic dose used in clinical practice for thromboembolic disorders. The TAC group was treated with a dose of 2 mg/kg/day, as stated by Lopes et al. [12] for 14 days. The TAC+RIV group was treated orally with RIV, 3 mg/kg/day, and after 60 minutes, TAC, 2 mg/kg/day, for 14 days. We calculated Cohen’s d effect sizes and 95% confidence intervals (CIs), and the interpretation of the Cohen’s d effect size was as follows: <0.20, small; 0.20–0.79, medium; ≥0.80, was considered large [13].
Blood and tissue samples collection
On day 15, mice were anesthetized and the blood were collected through the retro-orbital plexus. One part was collected in Ethylenediaminetetraacetic Acid (EDTA) tubes for estimation of the blood parameters, and the other portion was collected in a tube without EDTA and was centrifuged at 4,000 rpm for 15 minutes to separate serum used for creatinine, urea, and blood urea nitrogen (BUN) analysis. Tissues from all groups were collected in Davidson buffer for histopathology and immunofluorescence analysis.
Evaluation of blood cell counts
Blood parameters were measured by an automated hematology machine: ABX Micros 60 Analyzer (HORIBA Medical, France), where RBCs, WBCs as well as platelet counts were selected for the current study.
Estimation of the levels of serum BUN, creatinine, and urea
Levels of renal toxicity markers in serum samples were analyzed in accordance with the earlier method [14].
Deamination of blood glucose level
Blood glucose levels in all experimental animal groups were evaluated by one drop collection from each mouse using a glucometer (Uright, Taiwan).
Immunofluorescence examination of fibrinogen, p-AKT, PI3K, fibronectin, and TGF-β in mice renal tissues
Renal samples from all experimental animal groups were embedded in Davidson’s solution for paraffin block fixation and cut on super-frosted slides. The immunofluorescence was performed according to the modified methods of [15]. In brief, sections were deparaffinized by heating in an oven to 60°C and incubated with xylene, rehydrated through graded concentrations of ethanol. The step to retrieve the antigen was done by heating the sections in a microwave in citrate buffer (pH 6.0) for 15 minutes. Sections were washed in phosphate-buffered saline (PBS) comprising 0.05% Tween 20 and fixed with methanol for 5 minutes, then incubated in PBS comprising horse and bovine serum albumin for 45 minutes. Slides were exposed to the anti-fibrinogen, PI3K, TGF-β , and fibronectin mouse monoclonal antibodies and anti-p-AKT rabbit polyclonal antibody for 2 hours at 37°C, then overnight at 4°C. Tissues were incubated with Cyanine red (Cy3) goat anti-rabbit or goat anti-mouse Alexa 488 secondary antibodies. After washing, tissues were incubated 3 minutes with DAPI (4’,6-diamidino-2-phenylindole) to stain nucleus and mounted with fluoromount G. Figures were captured by Leica fluorescence microscope (Model: Leica DM 5500B, Leica Microsystems, Wetzlar, Germany) with at least six areas for each section with a minimum of 3 mice per group were analyzed by Image-J software (NIH, USA).
Histological estimation of the renal tissue sections.
Renal tissue samples were histopathologically stained using Hematoxylin and Eosin and analyzed blindly according to Abdel-Bakky et al. [16]. Histopathological scoring of the renal tubular cell necrosis was performed using H&E stain. The score was achieved by grades from 0 to 4 of necrosis, oedema, hemorrhage, and infiltration of the inflammatory cells as follows: 0 = absent, 1 = mild, 2 = moderate, 3 = severe, and 4 = very severe. Examination was done in 5 high-magnification fields for each mouse section as stated by Binker et al. [17].
Disposal of carcasses
Dead animals during and after the experiments and other biological wastes were isolated and stored in a sealed plastic bag in −20°C freezer. Finally, all bags were collected through the Veterinary hospital (Buraidah) and were incinerated.
Statistical analysis
All groups’ differences were considered significant at p value < 0.05, with results further categorized as p < 0.05, p < 0.01, and p < 0.001. Figures and tables data represented as mean ± SEM, and the analysis was accomplished by one way-ANOVA and Tukey–Kramer test as post ANOVA for multiple comparison using GraphPad Prism, version 8. Effect sizes were calculated using Cohen’s d and interpreted as follows: <0.20 (small), 0.20–0.79 (medium), and ≥0.80 (large), with 95% CIs provided where appropriate.
Ethical considerations
All animal experiments were accomplished in accordance with NIH guidelines (Eighth edition of Guide for the Care and Use of Laboratory Animals). All methods and procedures used in this experimental research were reviewed and authorized by Qassim University ethical committee with number (24-88-01) dated on April 28, 2024.
RESULTS
Effect of RIV on PLT, RBCs, and WBCs counts and blood glucose level in TAC-induced TIF
The count of platelets showed a significant increase in TAC (p < 0.001) group compared to control mice, and it demonstrated a significant lower platelets count (p < 0.05) in group of TAC+RIV compared to TAC-treated animals. In contrast, RBC count displayed a significant reduction (p < 0.001) in the TAC group in comparison to control mice with a significant increased (p < 0.001) count of RBCs in TAC+ RIV compared to TAC-treated mice. Compared to normal, WBCs count presented a significant reduction in TAC (p < 0.001) in treated mice and a significant increase in TAC+RIV (p < 0.05) group compared to TAC-treated mice. A significant elevation (p < 0.001) in blood glucose level in TAC+RIV groups was noted compared to TAC-treatment. In addition, the level of blood glucose showed significant elevation in TAC and TAC+RIV groups (p < 0.001) when compared with normal. Conversely, the TAC+RIV group demonstrated a significant reduction (p < 0.05) in blood glucose compared to TAC-treated animals. Remarkably, control and RIV groups demonstrating no significant difference for platelets, RBCs, and WBCs counts as well as the level of blood glucose (Table 1).
Effect of RIV on the levels of creatinine, BUN, and urea in TAC-induced TIF in mice
Renal toxicity markers, including creatinine Figure 1 (A), BUN (B), and urea (C), showed significantly increased levels (p < 0.001) in TAC in comparison to normal mice. Moreover, in TAC+RIV groups, a significant elevation was demonstrated in BUN (p < 0.01) as well as urea (p < 0.05) levels in comparison to normal. However, TAC+RIV groups exhibited significant reduction in creatinine, BUN (p < 0.05), and urea (p < 0.001) when compared with TAC-treatment. Remarkably, control and RIV groups showed no significant differences in the renal markers (Fig. 1A–C).
Effect of RIV and TAC treatment on the renal fibrinogen expression
Normal and RIV groups showed basal low fibrinogen expression in glomeruli and cortical tubules, while it showed strong fibrinogen expression in glomeruli, basolateral, and tubular interstitial areas of the cortex in TAC-treated mice. Treating animals with RIV and TAC displayed a significant (p < 0.001) reduction in fibrinogen expression in glomeruli compared with renal tissues from TAC-administered mice (Fig. 2A and B).
Effect of RIV on p-AKT and PI3K protein expressions in TAC-treated mice using double immunofluorescence technique
The renal expression of p-AKT (red fluorescence), besides PI3K (green fluorescence) of normal and RIV groups, demonstrated low expression in cortical tubular cells. However, TAC-treated mice presented strong expression of p-AKT in the cortical tubulointerstitial space, while the PI3K showed significant elevation in the cortical tubules compared with untreated mice. Animals received TAC and TAC displayed significantly lower expression of PI3K and p-AKT in the tubulointerstitial space and in the basolateral sites in the cortical tubules compared to groups of TAC-treated mice. Figure 3 represents double immunofluorescent figures (A), fluorescence intensities were calculated and blotted in a graph for p-AKT (B) and PI3K (C), or blotted as a histogram for p-AKT (D) and PI3K (E).
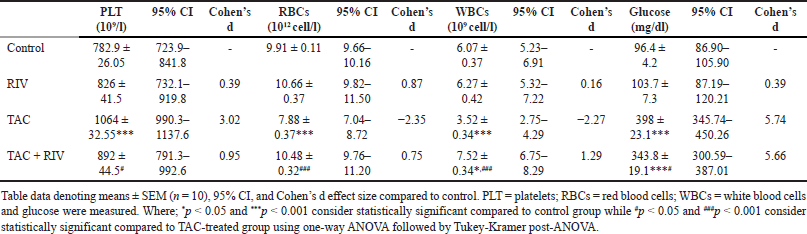 | Table 1. Effect of RIV on PLT, RBCs, WBCs and glucose in TAC-induced renal toxicity in mice. [Click here to view] |
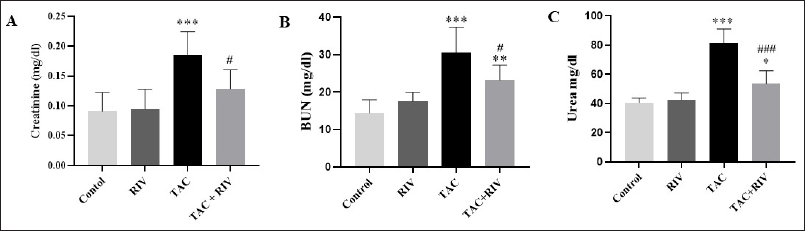 | Figure 1. Effect of TAC and RIV on renal injury parameters; creatinine (A), BUN (B) and urea (C). Data in the graph representing mean ± SEM (n = 10). Statistical analysis was performed using one-way ANOVA and Tukey-Kramer for multiple comparisons where: *p < 0.05, **p < 0.01 and ***p < 0.001 considered significantly different in comparison to normal mice and #p < 0.01 and ###p < 0.001 considered significantly different in comparison to TAC-treated mice. [Click here to view] |
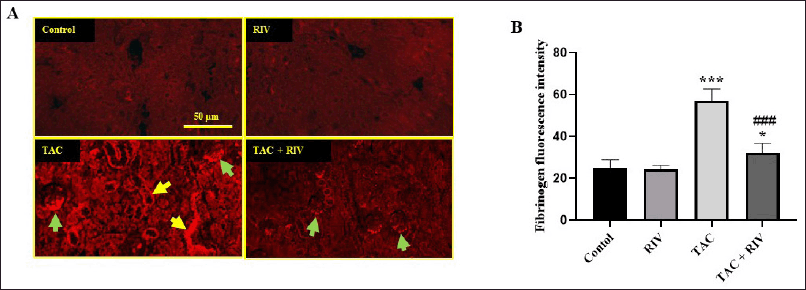 | Figure 2. Effect of RIV on the expression of fibrinogen protein in TAC-treated mice as representing by red immunofluorescent figures (A) or the calculated fluorescence intensities were blotted in graph (B). Control and RIV treated mice showing basal expression of fibrinogen in glomeruli and cortical tubules. TAC-treated mice showing strong fibrinogen expression in the glomeruli (green arrows) and the basolateral and tubular interstitial space of the cortex (yellow arrows). Treatment with RIV and TAC representing lower fibrinogen expression in the glomeruli (green arrows) and tubules. Data in the graph representing mean ± SEM (n = 10). Statistical analysis was performed using one-way ANOVA and Tukey-Kramer for multiple comparisons where: *p < 0.05 and ***p < 0.001 considered significantly different in comparison to normal mice and ###p < 0.001 considered significantly different in comparison to TAC-treated mice. [Click here to view] |
Effect of RIV and TAC treatment on histopathology features in mice
Histopathology figure (Fig. 4A) and histopathological scoring of the renal tubular cell necrosis (Fig. 4B) showed that control and RIV mice groups showed normal architectures, including normal glomeruli and normal tubules, whereas the TAC group represented tubulointerstitial hemorrhage, apoptotic nucleus of the tubules, and migrating immune cells in the interstitial space. Tissues from TAC+RIV showed low prevalence of interstitial hemorrhage, less nuclear apoptosis, and less immune cells migration (Fig. 4).
Renal expression of fibronectin and TGF-β in RIV and TAC-treated mice
The expression of fibronectin and TGF-β in normal and RIV-treatment displayed low expression of fibronectin and TGF-β proteins in cortical tubules and in glomeruli, whereas TAC-treated mice displayed a significant increase in fibronectin expression in tubules of cortical area and in glomeruli. On the other hand, TAC-treated mice showed a marked increase in fibronectin and TGF-β expressions in the interstitial tubular space and in the glomeruli. TAC+RIV group exhibited lower fibronectin and TGF-β in glomeruli and interstitial tubular space compared with TAC-treatment (Fig. 5A and B, respectively) A schematic representation of the proposed mechanism of RIV-mediated renoprotection against TAC-induced fibrosis is illustrated in Figure 6.
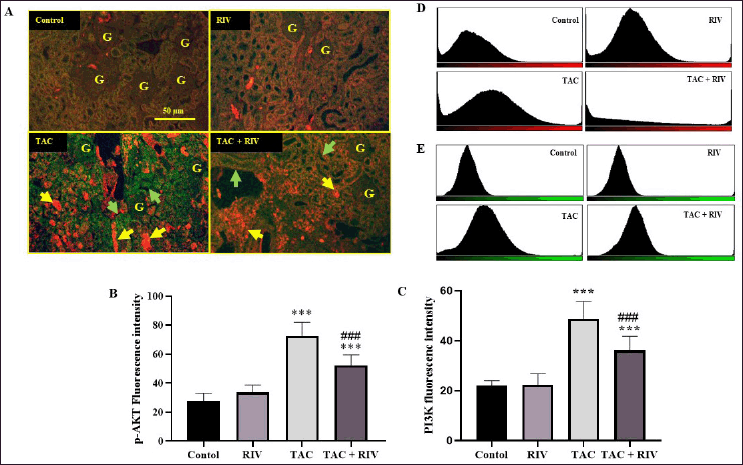 | Figure 3. Effect of RIV on p-AKT (red fluorescence) and PI3K (green fluorescence) protein expressions in TAC-treated mice as representing by double immunofluorescent figures (A), fluorescence intensities were calculated and blotted in graph for p-AKT (B) or PI3K (C) or blotted as histogram for p-AKT (D) and PI3K (E). Control and RIV treated group showing basal expression of p-AKT and PI3K in cortical tubular cells. TAC-treated animals presenting strong expression of p-AKT in cortical tubulointerstitial space (yellow arrows) while the PI3K showing localization in the cortical tubules (green arrows). Mice treated with RIV and TAC representing lower p-AKT and PI3K proteins expression in the tubulointerstitial space (yellow arrows) and in the basolateral sites in the cortical tubules. Data representing mean ± SEM (n = 10). Statistical evaluation was accomplished by one-way ANOVA followed by Tukey-Kramer for comparisons between groups where: ***p < 0.001 considered significantly different in comparison to normal mice and ###p < 0.001 considered significantly different in comparison to TAC-treated mice. [Click here to view] |
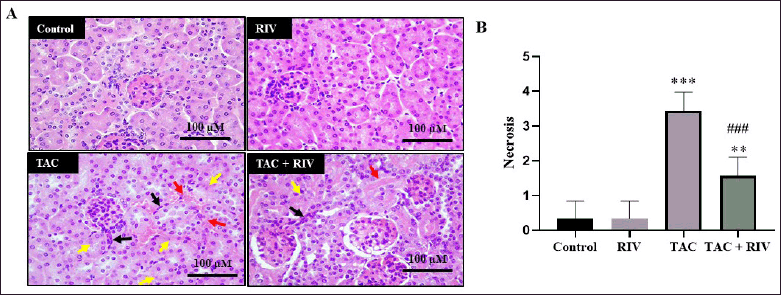 | Figure 4. Effect of RIV on tissue architectures in TAC-induced renal toxicity in mice (A) histology figure and (B) histopathological scoring of the renal tubular cell necrosis. Control and RIV treatment presenting average cortical tubules and normal glomeruli whereas in TAC-group, renal tissues displaying tubulointerstitial hemorrhage (red arrows), necrotic tubular nucleus (yellow arrows) and interstitial immune cell migration (black arrows). Animals treated with RIV and TAC viewing low prevalence of interstitial hemorrhage (red arrow), less nuclear apoptosis (yellow arrow) and less immune cells migration (black arrow). Magnification power is 200×. (B) Necrotic scores of tubular nuclei are blotted. Data, presented as mean ± SEM (n = 10). where **p < 0.01 and ***p < 0.001 consider significantly different compared to the control group, ###p < 0.001 consider significantly different consider statistically significant compared to TAC group. [Click here to view] |
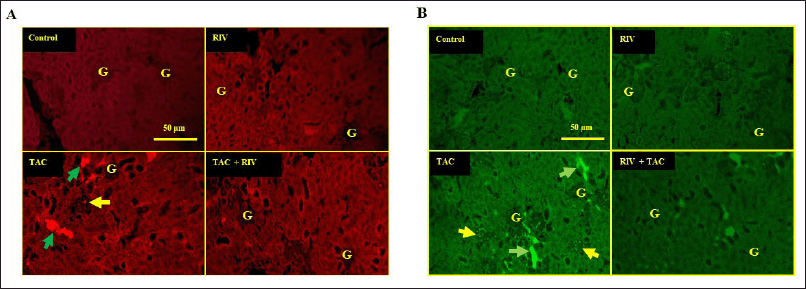 | Figure 5. Effect of RIV on fibronectin expression as represented by red fluorescence figures (A) and TGF-β expression as represented by green fluorescence figures (B) in TAC-treated mice (n = 10). Tissues of normal and RIV-treated animals displaying basal fibronectin and TGF-β expressions in tubules of cortical area and in glomeruli (G) whereas TAC-treated mice showing marked increase in fibronectin and TGF-β expressions in the interstitial tubular space (green arrows) and in the glomeruli (yellow arrow) compared to control tissues. TAC+RIV-treated mice exhibiting less fibronectin and TGF-β in in the interstitial tubular space and in the glomeruli. Magnification power is 400×. [Click here to view] |
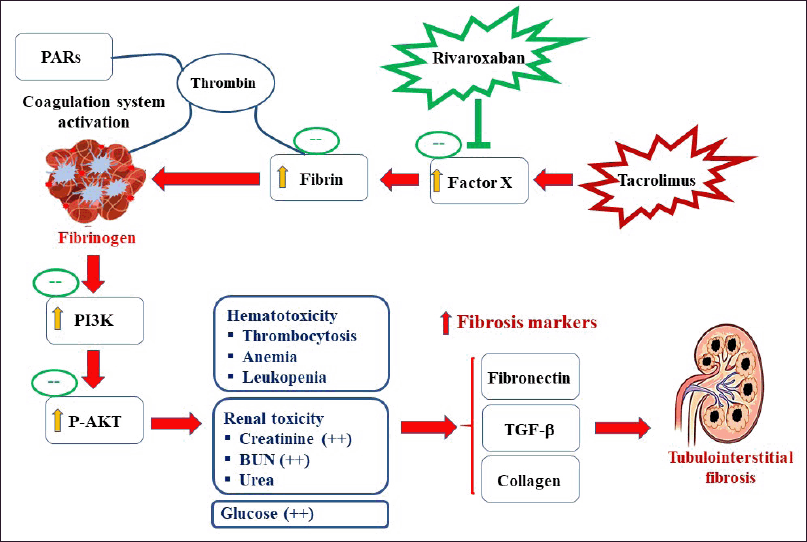 | Figure 6. The proposed mechanism of RIV-mediated renoprotection against TAC-induced fibrosis. PAR = protease-activated receptors. [Click here to view] |
DISCUSSION
Consistent with its well-documented nephrotoxic and diabetogenic effects, the present study demonstrates that TAC markedly alters hematological and metabolic (glucose) parameters. Notably, co-treatment with the direct FXa inhibitor, RIV, ameliorated many of these adverse changes. Thrombocytosis resulted from TAC in the current work is consistence with earlier work demonstrating that calcineurin inhibitors CIs can promote a prothrombotic state through cytokines activation and endothelial dysfunction [18]. This thrombocytosis may indicate the compensatory stimulation of bone marrow response to inflammation or vascular injury [19]. Interestingly, RIV in the TAC+RIV group significantly reduced thrombocytosis, potentially due to its attenuation of the hypercoagulable state, supported by prior evidence of its inhibitory effects on tissue factor expression and the coagulation-inflammation axis [20].
Furthermore, RIV improved anemia induced by TAC in the current work, possibly by improving microvascular perfusion. This aligns with previous work reporting the ameliorative effect of FXa inhibitors on oxidative stress and endothelial dysfunction in organ injury models [21]. Leukopenia, a common hematological side effect of TAC in experimental models [22], was also improved by RIV co-treatment, further underscoring its potential protective role. The resulted hyperglycemia in the groups of TAC and TAC+RIV supports earlier studies indicating TAC induces β-cell injury and insulin resistance [23].
Our results demonstrate that TAC is significantly increased renal toxicity markers, indicating its extensive renal toxicity. These findings are consistent with a prior study attributing TAC-induced nephrotoxicity to oxidative stress and profibrotic cytokine and vasoconstricting effect [18]. In the current work, RIV decreased TAC-induced elevation in renal toxicity markers, although their levels in TAC+RIV group remained significantly high compared to the normal control, indicating persistent injury or incomplete recovery.
Even though RIV co-treatment significantly attenuated renal toxicity markers induced by TAC, these markers did not fully normalized, suggesting only partial functional recovery. This may reflect the persistence damage or the limited duration of treatment. It is possible that a longer intervention period or increasing dose could improve the renoprotective efficacy of RIV. Future studies, including extended follow-up or multiple dosing regimens, are warranted to evaluate the durability and dose responsiveness of FXa inhibition in mitigating TAC-induced nephrotoxicity.
Although our results support the possible mitigating effect of RIV on several hematological, metabolic, and renal adverse effects induced by TAC, the clinical translation of these benefits must be approached with caution. It is noteworthy that RIV use in transplant patients is limited by some concerns, including difficulty in managing bleeding complications, as it lacks a reliable laboratory test for monitoring its anticoagulant effect [24]. In addition, its safety and efficacy in transplant recipients remain uncertain due to its limited clinical data [25]. Since, the dependence of RIV on renal clearance, raising concerns in patients with impaired kidney function [26].
In the present results, TAC elevated renal expression of fibrinogen expression in glomeruli, basolateral membranes, and tubular interstitial space, reflecting the pro-coagulant and pro-inflammatory effect of TAC. It is known that TAC enhances endothelial dysfunction, oxidative stress, and cytokine release, which may induce localized synthesis of fibrinogen [18]. Furthermore, increased expression of fibrinogen may induce TIF through ECM deposition and fibroblasts activating [27]. Besides its role in coagulation, FXa stimulates PARs in endothelial and epithelial cells, resulting in inflammation and fibrosis signals [28,29]. Interestingly, RIV significantly reduced fibrinogen expression in the glomeruli and renal cortex induced by TAC. This result highlights RIV’s possible anti-fibrotic and anti-inflammatory properties within the kidney that could be arise from its FXa inhibition.
Notably, increased interstitial hemorrhage, apoptotic nuclei in tubular cells, and increased infiltrated immune cells were seen after TAC treatment and were improved after RIV treatment. These finding is aligned with the earlier report stated the FXa inhibition reduces vascular permeability and endothelial injury [30]. Also, it is reported that TAC-induced renal fibrosis is mediated by inhibition of microthrombus formation and thrombin generation [28,29]. Indeed, future measurement of systemic coagulation biomarkers such as D-dimer, thrombin-antithrombin complex (TAT), or prothrombin fragment will strengthen the mechanistic link between FXa activity, inflammation, and renal fibrosis, and will help differentiate between local and systemic effects of RIV.
The signal pathway of PI3K/AKT mediates cell survival, proliferation, inflammation, as well as fibrogenesis mechanisms. The current results reveal that TAC has a significantly elevated p-AKT and PI3K expression in tubulointerstitial space, as demonstrated by the double immunofluorescence analysis indicated the pathological stimulation of the PI3K/AKT axis as a result of TAC treatment, that on line with former study [31]. Co-treatment with RIV significantly reduced the expression of both p-AKT and PI3K in cortical renal tissues, as shown by reduced fluorescence intensity and supported by fluorescence intensities quantification. This suggests the possible antifibrotic effect of RIV besides its anticoagulation. The suppressing effect of RIV on PI3K/AKT could be explained by the inhibitory effect of RIV on FXa that inhibit PAR-1 and PAR-2 receptors upstream of PI3K/AKT signaling cascades [28,29]. This subsequently suppresses the induction of TGF-β and CTGF, both of which are elevated through AKT/PI3K to enhance fibrogenesis [32]. It is important to recognize that although the antifibrotic, anti-inflammatory, and renoprotective effects observed in this study are attributed to RIV’s inhibition of FXa and subsequent attenuation of PAR-mediated signaling, we cannot fully exclude the possibility of off-target actions. Consequently, future studies comparing RIV with other structurally distinct FXa inhibitors (e.g., edoxaban or apixaban) and selective PAR-1/2 antagonists are warranted to confirm the specificity of the observed protective consequences and to further delineate the underlying mechanisms.
The fibrosis markers TGF-β and fibronectin, where fibronectin is a glycoprotein component of the ECM and TGF-β is a main regulator of fibrosis signals, including ECM protein deposition, initiation of EMT deposition, and activation of fibroblast [33,34]. In the current work, activation of fibrosis signals was seen in renal tissues of TAC-treated mice indicated by marked increase in expression of fibronectin and TGF-β in tubulointerstitial area and glomeruli. It has been reported that TAC-induced reactive oxygen species and cytokine release stimulating the production of TGF-β [31]. The production of TGF-β enhancing the pathway of Smad and therefore leading to the activating transcription of collagen and fibronectin, a component of ECM proteins [33]. In contrast, RIV markedly decreased TGF-β and fibronectin protein expression in both interstitial and glomerular regions, indicating that RIV inhibits TAC pro-fibrotic effects through the inhibition of FXa and consequently PAR-mediated signals [28].
Indeed, many mechanistic pathways have been extensively studied in Calcineurin inhibitor-induced renal fibrosis, including the Smad-dependent TGF-β signaling, ERK/p38 MAPK cascades, oxidative stress-mediated injury, and chemokine receptor-driven immune recruitment. These pathways have been targeted by several interventions such as anti-TGF-β approaches, antioxidants (e.g., N-acetylcysteine), or angiotensin receptor blockers. The current study is different as FXa–mediated activation of PAR-2 that has been shown to induce fibrotic cascades, including PI3K/AKT, in nonhemostatic tissues. FXa inhibitors may have pleiotropic effects not only the anticoagulant effect, but also its potential as anti-fibrotic and anti-inflammatory actions in cardiac, hepatic, and renal models [29,35].
Although the present findings support RIV as a promising adjunctive therapy to mitigate TAC-induced renal fibrosis, further translational research is warranted. Future studies should include validation in large animal or transplant models and identification of early biomarkers of fibrosis. A key area of investigation should also focus on whether RIV alters the immunosuppressive efficacy of TAC, potentially impacting graft acceptance, rejection episodes, or overall survival. Addressing these critical questions will be essential before RIV can be considered a viable clinical adjunct in transplantation medicine.
CONCLUSION
The findings of this study confirm the downregulation of fibrotic markers renal expression by RIV in TAC-induced TIF suggesting its anti-fibrotic potential through the downregulation of PI3K/AKT pathway. Together with improvements in renal function, histopathology, and signaling protein expression, these results suggest that RIV may serve as an effective adjunctive therapy to mitigate the long-term renal consequences of calcineurin inhibitor use. Future studies involving systemic inflammatory markers (e.g., TNF-α and IL-6) and renal cytokine profiling.
ACKNOWLEDGMENT
The authors gratefully acknowledge Qassim University, represented by the Deanship of Graduate Studies and Scientific Research, on the financial support for this research under the number (QU-J-PG-2-2025- 52988) during the academic year 1446 AH/ 2024 AD.
AUTHORS CONTRIBUTIONS
All authors made substantial contributions to conception and design, acquisition of data, or analysis and interpretation of data; took part in drafting the article or revising it critically for important intellectual content; agreed to submit to the current journal; gave final approval of the version to be published; and agree to be accountable for all aspects of the work. All the authors are eligible to be an author as per the International Committee of Medical Journal Editors (ICMJE) requirements/guidelines.
CONFLICTS OF INTEREST
The authors report no financial or any other conflicts of interest in this work
ETHICAL APPROVALS
The study protocol was approved by the Ethical Committee of Qassim University, Saudi Arabia (Approval No. 24-88-01; April 28, 2024), in accordance with the NIH Guide for the Care and Use of Laboratory Animals (8th Edition).
DATA AVAILABILITY
All the data is available with the authors and shall be provided upon request.
PUBLISHER’S NOTE
All claims expressed in this article are solely those of the authors and do not necessarily represent those of the publisher, the editors and the reviewers. This journal remains neutral with regard to jurisdictional claims in published institutional affiliation.
USE OF ARTIFICIAL INTELLIGENCE (AI)-ASSISTED TECHNOLOGY
The authors declares that they have not used artificial intelligence (AI)-tools for writing and editing of the manuscript, and no images were manipulated using AI.
REFERENCES
1. Nady ME, Abd El-Raouf OM, El-Sayed EM. Linagliptin mitigates TGF-β1 mediated epithelial–mesenchymal transition in tacrolimus-induced renal interstitial fibrosis via Smad/ERK/P38 and HIF-1α/LOXL2 signaling pathways. Biol Pharm Bull. 2024;47(5):1008–20. CrossRef
2. Ume AC, Wenegieme TY, Shelby JN, Paul-Onyia CDB, Waite AMJ, Kamau JK, et al. Tacrolimus induces fibroblast-to-myofibroblast transition via a TGFb-dependent mechanism to contribute to renal fibrosis. Am J Physiol Renal Physiol. 2023;324:F433–45. CrossRef
3. Knops N, Ramazani Y, De Loor H, Goldschmeding R, Nguyen TQ, van den Heuvel LP, et al. Tacrolimus induces a pro-fibrotic response in donor-derived human proximal tubule cells dependent on common variants of the CYP3A5 and ABCB1 genes. Nephrol Dial Transplant. 2023;38(3):599–609. CrossRef
4. Wang D, Chen X, Fu M, Xu H, Li Z. Tacrolimus increases the expression level of the chemokine receptor CXCR2 to promote renal fibrosis progression. Int J Mol Med. 2019;44(6):2181–8. CrossRef
5. Oe Y, Takahashi N. Tissue factor, thrombosis, and chronic kidney disease. Biomedicines. 2022;10(11):2737. CrossRef
6. Horinouchi Y, Ikeda Y, Fukushima K, Imanishi M, Hamano H, Izawa-Ishizawa Y, et al. Renoprotective effects of a factor Xa inhibitor: fusion of basic research and a database analysis. Sci Rep. 2018;8(1):10858. CrossRef
7. Bedreli S, Straub K, Achterfeld A, Willuweit K, Katsounas A, Saner F, et al. The effect of immunosuppression on coagulation after liver transplantation. Liver Transpl. 2019;25(7):1054–65. CrossRef
8. Fang L, Ohashi K, Ogawa H, Otaka N, Kawanishi H, Takikawa T, et al. Factor Xa inhibitor, edoxaban ameliorates renal injury after subtotal nephrectomy by reducing epithelial-mesenchymal transition and inflammatory response. Physiol Rep. 2022;10(5):e15218. CrossRef
9. Gill R, Meghrajani V. Tacrolimus-induced thrombotic microangiopathy after orthotopic heart transplant: a case report. Cureus. 2022;14(6):e25874. CrossRef
10. Wagner NM, Dressel T, Schäfer K, Konstantinides S. Effect of the factor Xa inhibitor rivaroxaban on arterial thrombosis in wild-type and apolipoprotein E-deficient mice. Thromb Res. 2012;130(5):793–8. CrossRef
11. Reagan-Shaw S, Nihal M, Ahmad N. Dose translation from animal to human studies revisited. FASEB J. 2008;22(3):659–61. CrossRef
12. Lopes CT, Gallo AP, Palma PVB, Cury PM, Bueno V. Skin allograft survival and analysis of renal parameters after FTY720 + tacrolimus treatment in mice. Transplant Proc. 2008;40(3):856–60. CrossRef
13. Cohen J. A power primer. Psychol Bull. 1992;112(1):155–9. CrossRef
14. Suhariningsih S, Glory S, Khaleyla F, Kusumawati HN, Septriana M, Susilo Y, et al. Ameliorative and renoprotective effect of electrical stimulation on blood sugar, blood urea nitrogen (BUN), creatinine levels, and the islets of langerhans weight in diabetic mice. Vet Med Int. 2022;2022:7922892. CrossRef
15. Abdel-Bakky MS, Hammad MA, Walker LA, and Ashfaq MK. Silencing of tissue factor by antisense deoxyoligonucleotide prevents monocrotaline/LPS renal injury in mice. Arch Toxicol. 2011;85:1245–56. CrossRef
16. Abdel-Bakky MS, Aldakhili ASA, Ali HM, Babiker AY, Alhowail AH, Mohammed SAA. Evaluation of cisplatin-induced acute renal failure amelioration using fondaparinux and alteplase. Pharmaceuticals. 2023;16(7):910. CrossRef
17. Binker MG, Binker-Cosen AA, Richards D, Gaisano HY, de Cosen RH, Cosen-Binker LI. Chronic stress sensitizes rats to pancreatitis induced by cerulein: role of TNF-α. World J Gastroenterol. 2010;16(44):5565–81. CrossRef
18. Naesens M, Kuypers DRJ, Sarwal M. Calcineurin inhibitor nephrotoxicity. Clin J Am Soc Nephrol. 2009;4(2):481–508. CrossRef
19. Vizioli L, Muscari S, Muscari A. The relationship of mean platelet volume with the risk and prognosis of cardiovascular diseases. Int J Clin Pract. 2009;63(10):1509–15. CrossRef
20. Ten Cate H. Tissue factor-driven thrombin generation and inflammation in atherosclerosis. Thromb Res. 2012:129 Suppl 2:S38–40. CrossRef
21. Torramade-Moix S, Palomo M, Vera M, Jerez D, Moreno-Castaño AB, Zafar MU, et al. Apixaban downregulates endothelial inflammatory and prothrombotic phenotype in an in vitro model of endothelial dysfunction in uremia. Cardiovasc Drugs Ther. 2021;35(3):521–32. CrossRef
22. Press R, de Fijter J, Guchelaar H-J. Individualizing calcineurin inhibitor therapy in renal transplantation - current limitations and perspectives. Curr Pharm Des. 2010;16(2):176–86. CrossRef
23. Shivaswamy V, Boerner B, Larsen J. Post-transplant diabetes mellitus: causes, treatment, and impact on outcomes. Endocr Rev. 2016;37(1):37–61. CrossRef
24. Connolly SJ, Milling TJ, Eikelboom JW, Gibson CM, Curnutte JT, Gold A, et al. Andexanet alfa for acute major bleeding associated with factor Xa inhibitors. N Engl J Med. 2016;375(12):1131–41. CrossRef
25. Talmor-Barkan Y, Yacovzada NS, Rossman H, Witberg G, Kalka I, Kornowski R, et al. Head-to-head efficacy and safety of rivaroxaban, apixaban, and dabigatran in an observational nationwide targeted trial. Eur Heart J Cardiovasc Pharmacother. 2022;9(1):26–37. CrossRef
26. Mueck W, Stampfuss J, Kubitza D, Becka M. Clinical pharmacokinetic and pharmacodynamic profile of rivaroxaban. Clin Pharmacokinet. 2014;53(1):1–16. CrossRef
27. Sörensen I, Susnik N, Inhester T, Degen JL, Melk A, Haller H, et al. Fibrinogen, acting as a mitogen for tubulointerstitial fibroblasts, promotes renal fibrosis. Kidney Int. 2011;80(10):1035–44. CrossRef
28. Borensztajn K, Peppelenbosch MP, Spek CA. Factor Xa: at the crossroads between coagulation and signaling in physiology and disease. Trends Mol Med. 2008;14(10):429–40. CrossRef
29. Foley JH, Conway EM. Cross talk pathways between coagulation and inflammation. Circ Res. 2016;118(9):1392–408. CrossRef
30. Brinkman HJM, Mertens K, Holthuis J, Zwart-Huinink LA, Grijm K, Van Mourik JA. The activation of human blood coagulation factor X on the surface of endothelial cells: a comparison with various vascular cells, platelets and monocytes. Br J Haematol. 1994;87(2):332–42. CrossRef
31. Kim CS, Mathew AP, Vasukutty A, Uthaman S, Joo SY, Bae EH, et al. Glycol chitosan-based tacrolimus-loaded nanomicelle therapy ameliorates lupus nephritis. J Nanobiotechnol. 2021;19(1):109. CrossRef
32. Kim CS, Kim IJ, Choi JS, Bae EH, Ma SK, Kim SW. Tamoxifen ameliorates obstructive nephropathy through Src and the PI3K/Akt/mTOR pathway. Biol Cell. 2019;111(1):18–27. CrossRef
33. Meng XM, Nikolic-Paterson DJ, Lan HY. TGF-β: The master regulator of fibrosis. Nat Rev Nephrol. 2016;12(6):325–38. CrossRef
34. Liu Y. Cellular and molecular mechanisms of renal fibrosis. Nat Rev Nephrol. 2011;7(12):684–96. CrossRef
35. Goto M, Miura S ichiro, Suematsu Y, Idemoto Y, Takata K, Imaizumi S, et al. Rivaroxaban, a factor Xa inhibitor, induces the secondary prevention of cardiovascular events after myocardial ischemia reperfusion injury in mice. Int J Cardiol. 2016:220:602–7. CrossRef