INTRODUCTION
Drug transporters and drug metabolizing enzymes play a key role in the biotransformation and excretion of xenobiotics. They are also vital in maintaining the homeostasis of endobiotics in the body by regulating the transportation and metabolism of the endobiotics [1–3]. Uridine 5?-diphospho-glucuronosyl transferases (UGTs) are a class of phase-2 metabolising enzymes that catalyse the transfer of glucuronic acid from uridine 5?-diphospho-glucuronic acid to their substrates. UGTs are responsible for eliminating the majority of endobiotics and xenobiotics by the glucuronidation pathway. The endobiotics glucuronidated by different UGTs include catecholamines such as serotonin and dopamine; steroidal hormones like estradiol, progesterone, testosterone, androsterone, aldosterone, estrone, estriol; corticosteroids like cortisol; and retinoids and bile acids [4–7]. Modulation of UGTs (via inhibition or induction) by any drug can significantly affect the homeostasis of endobiotics which are eliminated by glucuronidation. This can potentially lead to drug-endobiotic interactions (DEIs). Some of these interactions can be detrimental to the safety of the patient receiving the drug. A classic example of this type of DEI is between atazanavir and bilirubin. In this case, atazanavir inhibits UGT1A1 (an enzyme that metabolises bilirubin by glucuronidation), resulting in increased bilirubin levels in the blood and eventually leading to hyperbilirubinemia in patients receiving atazanavir [8]. Another example is the interaction between phenytoin and thyroxine hormone. Thyroxine is essential for the development of the brain. It is metabolized by a glucuronidation reaction by UGT1A1 isoform and UGT1A3, 1A8, and 1A10. Phenytoin is an anticonvulsant drug used in the treatment of seizures. Phenytoin is reported to cause the induction of UGT1A1 enzymes. It was reported that administration of phenytoin in children suffering from seizures/epilepsy showed an increased risk of developing neurotoxicity due to the decreased levels of thyroxine. This is due to the rapid metabolism of thyroxine by the UGT1A1 enzymes, induced by phenytoin, causing a significant decrease in thyroxine levels and, thereby, neurotoxicity [9,10]. Therefore, induction or inhibition of UGTs can accordingly result in a decrease or increase in the plasma levels of endobiotics which are metabolised by UGTs. However, the clinical impact of change in the plasma concentration of an endobiotic due to the modulation of UGTs is dependent on the physiological role played by that endobiotic. Hence, a case-by-case analysis should be done to understand and evaluate such drug-endobiotic interactions. Preclinical assessment in laboratory animals can provide critical information on such interactions as studies in human volunteers, especially patients are necessary before making any decision.
The inhibitory effect of hepatic and intestinal UGT enzymes is not yet studied, although they mediate glucuronidation of endogenous bile acids and bilirubin [11–13]. Bile acids auto-regulate their own transport and metabolism and also maintain metabolic homeostasis via nuclear receptors. Disruption of this homeostasis can contribute to a wide range of gastrointestinal and liver diseases such as cholestasis, MASH (Metabolic Dysfunction-Associated Steatohepatitis) hepatocellular carcinoma, and irritable bowel syndrome [14,15]. Interestingly, the current use of bile acids like chenodeoxycholic acid and ursodeoxycholic acid as active drugs in the treatment of liver diseases further imparts the significance of their functional role in the pathophysiological and disease conditions [16]. In the current study, we aimed to investigate the effect of UGT inhibition on bilirubin and bile acid homeostasis in the rat model. We evaluated Zafirlukast as a common UGT1A1/UGT1A3 inhibitor in vitro and confirmed its inhibitory potential in rats by studying the change in disposition of ezetimibe, (a UGT1A1 and UGT1A3 substrate) The effect of inhibition of UGT1A1 and UGT1A3 on the systemic concentrations of bilirubin and bile acids in rats was investigated to understand DEIs.
MATERIALS AND METHODS
Chemicals and reagents
Zafirlukast, ezetimibe, and telmisartan reference compounds were procured from TCI Chemicals, India. Ezetimibe-glucuronide was obtained from Clearsynth, India. Tris-hydrochloride, magnesium chloride (MgCl2), polysorbate 80, dimethyl sulfoxide (DMSO), and dipotassium ethylenediamine tetraacetate (K2EDTA) were purchased from SRL Chemicals, Hyderabad, India. Alamethicin and UDPGA were purchased from Sigma Aldrich Chemicals Pvt. Ltd, India. Formic acid, purified water (mass spectroscopy grade), and solvents (acetonitrile and methanol) were obtained from Biosolve India Limited, India. Bilirubin (Total & Direct) kit was purchased from Erba®Mannheim, Mumbai, India. Human liver microsomes were purchased from GIBCO, Thermo Scientific (MA, USA). Rat-pooled plasma and male SD rats were obtained from Hylasco Biotechnology Private Limited, Hyderabad, India.
Preparation of reagents
50 mM Tris-HCl (pH adjusted to 7.4) was prepared in LC-MS grade water. Aqueous solutions of MgCl2 and UDPGA cofactor were prepared at 100 mM concentrations separately, using the above buffer as the diluent. Alamethicin solution at a strength of 5 mg/ml was prepared using ethanol as the diluent. For the in vitro studies, different concentrations of Zafirlukast and ezetimibe were prepared using DMSO as solvent.
In vitro studies
Ezetimibe enzyme kinetics parameters (S50/Ki/Km and Vmax) were evaluated in human liver microsomes, adopting previously reported methods with slight modifications [17]. The assay conditions, including protein concentration and time of incubation, were optimized. The final incubation mixture (100 µl) consisted of HLM (0.25 mg/ml), 5 mM UDPGA, 50 mM Tris-HCl buffer (pH 7.4), alamethicin (10 µg/ml), MgCl2 (5 mM), and different concentrations of ezetimibe (0.073–53.33 µM). Briefly, the incubation mixture sufficient for triplicate reactions was prepared with Tris buffer, magnesium chloride, HLM, and alamethicin and then incubated on ice for 15 minutes. Then 94 µl of this mixture was added to each well of a 96-well plate, and 1 µl of different concentrations of ezetimibe (0.073–53.33 µM) was added, gently vortexed, and incubated in a water bath temperature maintained at 37°C for 5 minutes. Finally, 5 µl of UDPGA (pre-warmed at 37°C) was added to each well and incubated for 10 minutes at 37°C. To the reaction mixture, 0.3 ml of ice-cold quenching solvent (acetonitrile consisting of internal standard (telmisartan), 100 ng/ml) was added to terminate the reaction, and the plate was kept on a mixmate for 10 minutes at 900 rpm and subjected to centrifugation at 4,000 rpm for 20 minutes. The clear supernatant was separated and analyzed by mass spectrometry (UHPLC-MS/MS) to determine the concentration of ezetimibe glucuronide in the samples. The data from the enzyme kinetics data was analyzed using GraphPad Prism. Kinetic behavior was determined by fitting the data into Michaelis-Menten, substrate inhibition, and allosteric sigmoidal equations to determine the most appropriate model based on the goodness of fit and the various statistical parameters. The reaction rate constant (Km/S50/Ki) and maximum reaction velocity (Vmax) were determined from the identified kinetic model. The study was conducted in triplicates, and the values are reported as mean ± SD. The following equations were used to analyze the enzyme kinetics data.
[V = velocity, [S] = substrate concentration, Vmax = maximum reaction velocity, S50 or Km = concentration of substrate at half of . Vmax ki = inhibition constant, and n =Hill coefficient].
The inhibitory potential of Zafirlukast on the glucuronidation of ezetimibe mediated by UGT enzymes was tested in HLM to determine its half-maximal inhibitory concentration (IC50). Enzyme inhibition studies were performed in the final incubation mixture (100 µl) containing 50 mM Tris buffer, 5 mM magnesium chloride, 10 µg/ml alamethicin, 1 µM substrate, different concentrations (0.247–540 µM) of inhibitor, HLM at 0.25 mg/ml concentration, and 5 mM UDPGA. All reactions were carried out in a 96-deep well plate. A sufficient amount of master mix consisting of Tris buffer, MgCl2, alamethicin, and HLM was kept on ice for 15 minutes. The substrate was then added to the master mix to yield a concentration accounting for 1 µM and mixed gently. 94.5 µl of this mixture was transferred to each well of the incubation plate, and 0.5 µl of different strengths of the test items was transferred to the respective labeled wells. The reaction mixture was pre-incubated in a shaking water bath for 5 minutes at a set temperature of 37°C. Then, the pre-warmed UDPGA solution of 5 µl was added to each well of the incubation plate and continued the incubation for another 10 minutes. After incubation, the reaction was stopped by adding 300 µl of ice-cold quenching solvent (acetonitrile consisting of internal standard (telmisartan), 100 ng/ml), and the plate was kept on a mixmate at 900 rpm for 10 minutes and subjected to centrifugation at 4,000 rpm for 20 minutes. The clear supernatant was collected and analyzed by UHPLC-MS/MS. DMSO was used as a vehicle control. One well in each replicate without a cofactor was used to represent the total substrate concentration at the end of incubation, which was used in the calculation of the percentage substrate remaining at each inhibitor concentration. Data was analyzed using GraphPad Prism by non-linear regression using the Hill equation. IC50 values were reported as mean ± standard deviation of replicates.
In vivo drug-drug interaction (DDI) study
The DDI studies were conducted in male SD rats to assess the potential of Zafirlukast in inhibiting the UGT-mediated metabolic clearance of ezetimibe. Prior approval was obtained from the institutional animal ethical committee (IAEC) of BITS Pilani Hyderabad Campus (Approval number: BITS/IAEC/2022/38) for the in vivo study protocol. The study was performed as per the guidelines prescribed by the Committee for Control and Supervision of Experiments on Animals (CCSEA), India. Male SD rats (7–8 weeks of age) weighing between 200–250 g were obtained and kept in quarantine for 7 days under standard laboratory air and light conditions. The rats were housed in polypropylene cages (3/cage), with facilities for food and water ad libitum. Controlled temperature (22°C ± 1°C) and % RH (50% ± 10%) were maintained, and approximately 12 hours of dark and 12 hours of light cycles were followed. Animals were kept on an overnight fasting before the oral dosing of drugs used in the study. Rats were divided into three groups viz., Group-I (Ezetimibe), Group-II (Zafirlukast), and Group-III (Ezetimibe + Zafirlukast) (n = 3). The Group-I animals were administered ezetimibe (substrate) only, Group-II animals received Zafirlukast (inhibitor) only, while Group-III animals were co-administered ezetimibe with zafirlukast (substrate + inhibitor). Formulations of drugs for oral dosing were freshly prepared in DMSO (2%), polysorbate 80 (2%), and purified water (96%) before dosing. Both the substrate and inhibitor were given at 10 mg/kg and 5 ml/kg of dose and dose volume, respectively, by oral gavage. Group-I and Group-II animals were given blank vehicle formulations to match the dose volumes to that of the combination group (blank vehicle doses were administered after administering the drug doses to each group). Blood was sampled by retro-orbital under slight isoflurane anesthesia at 0.25, 0.5, 1, 2, 4, 6, 8, and 24 hours post-dosing from each animal into an anticoagulant (200 mM K2EDTA at 2% concentration in blood) containing centrifuge tubes and kept on an ice bath until processing. Plasma was harvested by centrifuging at 10,000 rpm for 10 minutes, temperature set at 4°C, and stored in a freezer (−80°C) till further use.
In vivo drug-endobiotic interaction study
The effect of UGT1A1/UGT1A3 inhibition by Zafirlukast on the plasma levels of bile acids was assessed in male SD rats. Prior approval for the in vivo study protocol was obtained from the IAEC of BITS Pilani Hyderabad Campus (Approval number: BITS-IAEC-2023-17) and in accordance with CCSEA, India. Male SD rats were maintained, as mentioned in the above section. Animals were grouped into vehicle control and treatment groups, each group containing six animals (n = 6). Aqueous solution of Zafirlukast was prepared using DMSO (2%), polysorbate 80 (2%), and purified water (96%). The drug (Zafirlukast) was administered at 10 mg/kg and 5 ml/kg of dose and dose volume, respectively, using oral gavage, while only the blank formulation (without the drug) was administered at 5 ml/kg to the vehicle control group. Respective formulations (blank or Zafirlukast formulation) were administered for 7 days once daily. Following the last dose on day 7, blood samples were collected by retro-orbital under slight isoflurane anesthesia at 0.25, 0.5, 1, 2, 4, 8, and 24 hours from each animal into centrifuge tubes containing an anticoagulant (200 mM K2EDTA at 2% v/v concentration in blood). The centrifuge tubes containing the blood samples were stored at 4°C. The blood samples were centrifuged at 10,000 rpm for 10 minutes at 4°C to separate the plasma. The collected plasma was stored in a freezer (set at a temperature of −80°C) until analysis.
Instrumentation and bioanalysis
UHPLC-MS/MS (SCIEX QTRAP® 4500 mass spectrophotometer, SCIEX, MA, USA) (Nexera 40D-XS Liquid chromatography, Shimadzu Corporation, Kyoto, Japan) was employed to quantify ezetimibe, ezetimibe-glucuronide, zafirlukast, and bile acids in the samples obtained from in vitro and in vivo studies. Analyst 1.7 version software was used to acquire and integrate the chromatograms obtained during the sample analysis. Protein precipitation was the sample preparation method for in vitro and in vivo samples. Negative electrospray ionization was applied during the analysis. Calibration curves were constructed in the range of 0.25–2000 ng/ml (0.25, 0.5, 1, 2, 10, 50, 200, 550, 800, 1,600, and 2,000 ng/ml) for ezetimibe, 2–8,000 ng/ml (2, 10, 50, 200, 500, 800, 900, 1,000, 2,000, 4,000, and 8,000 ng/ml) for ezetimibe-glucuronide and 1–1,000 ng/ml (1, 2, 10, 50, 200, 500, 800, 900, and 1,000 ng/ml) for Zafirlukast and, the method linearity was assessed by performing the least-square linear regression analysis of observed concentrations versus the nominal concentrations of the analyte for the calibration curve samples with 1/×2 weighting factor. The chromatographic separation of ezetimibe and ezetimibe glucuronide was achieved on the Kinetex polar C18 column (4.6 × 50 mm, 2.6 µm) (Phenomenex, Hyderabad, India). The chromatography of Zafirlukast was developed using a Cortecs C8 column (2.1 × 50 mm, 2.7µm) (Waters India Private Limited, Bangalore, India). The combination of 10 mM ammonium formate in water (mobile phase A) and acetonitrile with 0.1% formic acid (mobile phase B) was pumped at a flow rate of 0.6 ml/minute using the gradient program: 0.00 minutes—10% B, 0.80 minutes—90% B, 1.60 minutes—90%B, 1.61 minutes—10% B, 3.00 minutes—10% B. and 2 µl of final sample was injected into the instrument (extracted plasma samples of Zafirlukast were diluted to 50-folds and submitted for analysis). The column oven and the autosampler were maintained at 40°C and 15°C, respectively. UHPLC-MS/MS details of ezetimibe, ezetimibe-glucuronide, Zafirlukast, and IS were given in Table S1 (supplementary data), and their respective analytes, IS, and blank chromatograms were shown in Figure S1a–e (supplementary data).
The previously developed and validated bioanalytical method was used for quantifying cholic acid chenodeoxycholic acid (CDCA), deoxycholic acid (DCA), glycodeoxycholic acid (GDCA), taurodeoxycholic acid (TDCA), tauro-alpha-muricholic acid (Tα-MCA), and tauro-beta-muricholic acid (Tβ-MCA) in the plasma samples [18]. Protein precipitation was used to extract plasma bile acids. The reported method was developed in a calibration range of 1–1,000 ng/ml for each of the bile acids. The complete details of the sample preparation, method development, chromatographic and mass spectrometric conditions, and method validation with the results are discussed in our reported paper [18]. The serum bilirubin levels were measured by collecting the blood samples from all the animals at 0.5 hours after dosing on day- 7 from all animals. The serum bilirubin content was measured in the samples using the biochemical analysis. Bilirubin glucuronide directly reacts with sulphodiazonium salt and forms coloured azobilirubin, which can be measured by a colorimetric method using a spectrophotometer. Serum total and direct bilirubin were measured by using an Erba®Mannheim kit (BLT00011), and the assay was performed as per the instructions provided by the manufacturer.
Pharmacokinetic analysis
Phoenix WinNonlin® software (Version 8.3) was used to calculate the pharmacokinetic parameters using non-compartmental model analysis.
Statistical analysis
The effect of Zafirlukast on the systemic levels of the seven bile acids (CA, CDCA, DCA, GDCA, TDCA, Tα-MCA, and Tβ-MCA) was assessed by comparing the mean AUC0-24h of plasma concentration time course profile of each bile acid in control and treatment animals. The AUC0-24h values of each bile acid obtained in the pharmacokinetic study were expressed as mean ± standard deviation observed in six rats. An unpaired t-test, at a 5% level of significance, was used to analyze the statistical difference in the ‘AUC0-24h’ of plasma concentration time course profile of each bile acid in both groups. GraphPad Prism software (version 6, GraphPad Software Inc., CA, USA) was used to perform the statistical analysis of the data obtained in the study.
RESULTS
In vitro studies
Enzyme kinetics parameters (Km/S50/Ki and Vmax) were determined, and the profiles were evaluated based on goodness of fit and Eadie-Hofstee plots. Ezetimibe-β-D-glucuronide formation rate was used to assess ezetimibe metabolism by HLM. The glucuronidation conjugation of ezetimibe in HLM was found to follow SI kinetics. The Michaelis-Menten constant (Km), and maximum reaction velocity (Vmax) values were determined as 13.23 ± 2.37 µM and 14,275 ± 1,633 ng/minute/mg protein, respectively. Since ezetimibe followed SI kinetics (from the Eadie-Hofstee plot), the inhibition constant (Ki) was calculated, and the value of ‘Ki’ was found to be 67.49 ± 17.56 µM.
The inhibitory potential of Zafirlukast on ezetimibe glucuronidation was determined in HLM. At ezetimibe concentrations corresponding to less than 5-fold below its Km value, Zafirlukast showed inhibition of glucuronidation of ezetimibe with the IC50 value of 16.41 ± 3.65 µM. Both the enzyme kinetics and inhibition profiles are illustrated in Figure 1.
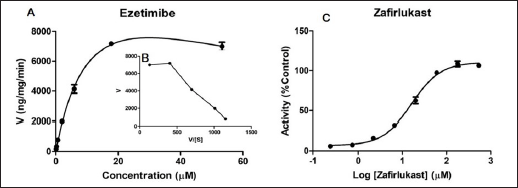 | Figure 1. UGT-mediated enzyme kinetics profile of ezetimibe (A) and respective Eadie-Hofstee plot (B); and UGT inhibition potential of Zafirlukast on ezetimibe glucuronidation (C) in HLM. Each data point value is the mean ± SD of 3 independent incubations. [Click here to view] |
In vivo drug-drug interaction study
Mean plasma concentration-time profiles for a single oral dose of ezetimibe or Zafirlukast alone and co-administration of ezetimibe and Zafirlukast are illustrated in Figures 2 and 3. The pharmacokinetic parameters, such as Tmax, Cmax, AUC0-last, and AUC0-∞ for both groups were reported in Table 1. Ezetimibe rapidly reached the maximum concentration within 0.25 hours in both cases. The ratio of Cmax/AUC determined from the plasma time course profiles of ezetimibe when administered alone and in combination with Zafirlukast was 0.29 and 0.43, respectively. However, there was no difference in the pharmacokinetic profile of Zafirlukast when co-administered with ezetimibe. The pharmacokinetic parameters, such as Tmax, Cmax, AUC0-last, and AUC0-∞ for both groups were reported in Table 1. Zafirlukast reached the maximum concentration within 0.5 hours in both cases. The Cmax and AUC0-last values of Zafirlukast were similar in both cases. The mean plasma time course profiles obtained following a single oral dose of Zafirlukast alone and co-administration of ezetimibe and Zafirlukast are illustrated in Figure 3.
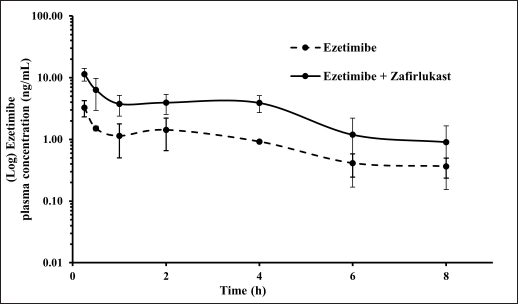 | Figure 2. Plasma concentration-time curves of ezetimibe obtained following the administration of ezetimibe alone and ezetimibe in combination with Zafirlukast in male SD rats. [Click here to view] |
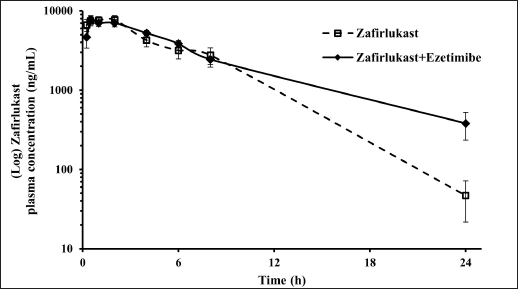 | Figure 3. Plasma concentration-time curves of Zafirlukast obtained following the administration of Zafirlukast alone and Zafirlukast in combination with ezetimibe in male SD rats. [Click here to view] |
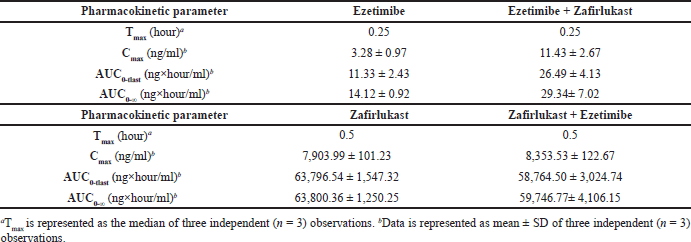 | Table 1. Pharmacokinetic parameters of ezetimibe obtained following oral administration of ezetimibe and co-administration of ezetimibe and Zafirlukast, and Pharmacokinetic parameters of Zafirlukast following oral administration of Zafirlukast and co-administration of Zafirlukast and ezetimibe in male SD rats. [Click here to view] |
In vivo drug-endobiotic interaction study
A statistically significant reduction was observed in the plasma exposure (expressed in terms of AUC0-24h) of CA and CDCA by 71.46% (p = 0.014) and 92.05% (p < 0.0001), respectively, in the treatment group compared to vehicle control animals. Statistically, no difference (p > 0.05) was observed in the plasma exposure of DCA, GDCA, Tα-MCA, and Tβ-MCA. Interestingly, the plasma levels of TDCA increased by 79.99%, but without statistical significance. While the systemic levels of bilirubin were unaffected in the treatment group compared to control animals. Effects of Zafirlukast on systemic exposure to the mentioned bile acids and bilirubin are shown in Figure 4 and Table 2.
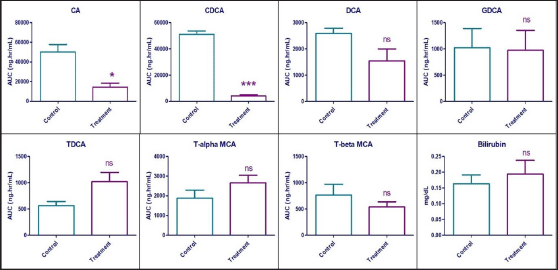 | Figure 4. Area under the plasma concentration vs time curve of seven bile acids and serum bilirubin concentrations in vehicle control and treatment animals after 7 days exposure to Zafirlukast in male SD rats (n = 6). ns—Statistically no significant difference between control and treatment values (p > 0.05) * – Statistically significant difference between control and treatment values (0.01<p < 0.05) *** – Statistically significant difference between control and treatment values (p < 0.0001). [Click here to view] |
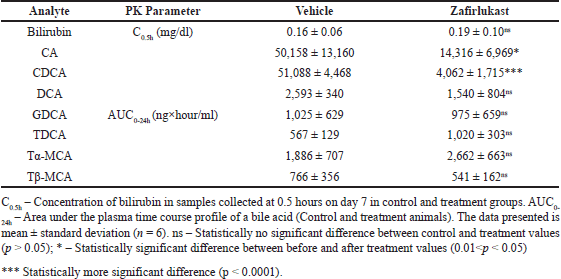 | Table 2. Serum concentrations of bilirubin and area under the curve of seven plasma bile acids in control and treatment male SD rats (n = 6). [Click here to view] |
DISCUSSION
The UGT-mediated DEIs are attracting more interest in the pharmaceutical industry due to their beneficial or detrimental roles in health and disease conditions [19]. Investigating such DEIs helps unravel key mechanisms in pathophysiology or deepen the understanding of endobiotic response upon xenobiotic exposure [20]. Bile acids not only regulate their own metabolism but also determine the fate of other endogenous molecules, which can lead to significant clinical outcomes [20]. As a result, either UGT inhibition or induction plays crucial roles in the homeostasis of different endobiotics and their subsequent implications in disease modification. It is, therefore, essential to study the effects of xenobiotic drugs on these UGT mechanisms to ensure the safety and non-specific pharmacological profiles of drugs.
In particular, some of the drug transporters and drug metabolizing enzymes are specifically involved in the metabolism and transportation of endogenous bile acids [11]. Xenobiotic receptors, such as the Pregnane X receptor (PXR), constitutive androstane receptor (CAR), and aryl hydrocarbon receptor (AHR), are a few such receptors involved in such processes. Modulation (either activation or inhibition) of the xenobiotic receptors (PXR, CAR, AhR, and FXR) can affect the gene expression of drug transporters and drug metabolizing enzymes, which can, in turn, affect the pharmacokinetic properties of xenobiotics and/or endobiotics that are substrates for such enzymes/transporters [21,22]. These xenobiotic receptors are modulated by a variety of endogenous and exogenous ligands and environmental chemicals [23]. Bile acids, by binding to their nuclear receptors, regulate lipid, glucose, and energy homeostasis and are involved in inflammation, cell proliferation, and immunomodulatory effects. Moreover, gastrointestinal and hepatic diseases are intertwined with altered bile acid profiles [15,24]. Despite the clinical significance, the effect of inhibition of UGT metabolism of bile acids has not yet been studied. In the current research work, we studied the effect of a pan-UGT inhibitor (Zafirlukast) on the plasma levels of seven bile acids following oral dose administration of the drug for 7 consecutive days in rats and compared with vehicle control animals. In addition to the bile acids, bilirubin (endogenous UGT1A1 substrate) was also measured. In accordance with the theoretical principles, the concentration of a substrate should increase when its metabolic enzyme(s) are inhibited. This correlation was not observed; instead, completely opposite results were observed for CA and CDCA, which is an interesting finding in this work. The reason for this could be the feedforward mechanism for UGT enzymes that are involved in the glucuronidation of these selected bile acids (i.e., CA and CDCA). This assumption is further supported by the reported literature that activation of FXR by both endogenous and exogenous agonists resulted in the induction of the UGT1A3 enzyme [25]. UGT1A3 catalyzes the glucuronidation of bile acids such as CA and CDCA at the carbon-24 position of carboxylic acid to form their respective acyl-glucuronides.
In general, inhibition of UGT1A3 in the intestine and liver results in an increase in the plasma concentration of CA and CDCA. These unconjugated bile acids are also reported to act as endogenous FXR agonists. Activation of FXR by these endogenous bile acids leads to the feedback mechanism for bile acid synthesis. Briefly, in the feedback mechanism, binding of these unconjugated bile acids to FXR leads to the release of fibroblast growth factor 15/19 (FGF15/19) in the intestine, and enters the liver via portal circulation and inhibits the CYP7A1 enzyme (a rate-limiting enzyme in bile acid synthesis). In addition, activation of FXR in the liver results in the release of a short heterodimer partner, which also inhibits CYP7A1. This feedback mechanism inhibits the bile acid biosynthesis from cholesterol in the liver. Therefore, such a feedback mechanism is possibly attributed to the reduced bile acid levels after UGT1A3 inhibition by Zafirlukast [12,26].
Furthermore, literature reports suggest that activation of FXR also leads to the induction of UGT1A enzymes. This can result in increased levels of UGT1A3 (which is part of the UGT1A isozymes), which is involved in the metabolic clearance of CA and CDCA by glucuronidation conjugation, thereby decreasing their plasma levels. This could be a second possible reason for the overall decrease in the plasma levels of these two unconjugated bile acids. This mechanism is called the feedforward mechanism [27,28]. Therefore, both the bile acid-FXR-mediated feedback mechanism (inhibition of bile acid synthesis) and feedforward mechanism (induction of UGT enzymes) may be responsible for the overall reduction in the plasma levels of CA and CDCA. Overall, the changes in the bile acid profiles after 7 days of exposure to Zafirlukast seem to be mediated by the involvement of FXR-mediated UGT expression and activity. Hence, FXR plays a major role in the regulation of bile acid homeostasis by either feedback or feedforward mechanisms.
Bilirubin is a well-noted specific substrate for the UGT1A1 isoform, and its inhibition should lead to increased levels of bilirubin that should result in hyperbilirubinemia in rats. Inhibition of UGT1A1 by Zafirlukast could not alter the bilirubin levels. Mahmoud et al. [29] reported similar results when they studied the effect of multi-dose administration of Zafirlukast (at a dose of 80 mg/kg every 24 hours for 10 days) on bilirubin levels in the hepatic ischemia perfusion rat model. They did not find any significant effect on the plasma bilirubin levels [29]. Moreover, bilirubin was reported to regulate its own metabolism by induction of UGT1A1 expression [30]. FXR agonists like UDCA, obeticholic acid, and GW4064 induce intestinal UGT1A1 by direct or indirect regulation [31]. In addition to FXR, other nuclear receptors or nuclear factors like PXR, CAR, AhR, Nrf2, and PPARα also regulate UGT1A1 transcription [32]. Direct binding of Zafirlukast to these receptors or factors may also affect the expression of UGTs. Zafirlukast was found to inhibit UGT enzymes in a substrate-specific manner, i.e., the UGT inhibitory potential is dependent on the substrate being used in the reaction. This substrate-specific inhibition might also be a possible reason for the unaltered bilirubin levels after zafirlukast exposure in rats [33]. In addition, the time of zafirlukast exposure (7 days only) may not be sufficient to exert significant changes in the bilirubin levels in rats. The inhibition or induction potential of xenobiotics on UGT1A1 or UGT1A3 enzymes has to be evaluated at the preclinical stage to avoid DEIs between drug molecules and bilirubin or bile acids. In addition, zafirlukast is a cysteinyl leukotriene receptor 1 antagonist, thiol isomerase inhibitor, and modulator of human soluble epoxide hydrolase, farnesoid X receptor, and peroxisome proliferator-activated receptor-gamma receptors. This off-target action of zafirlukast may potentially contribute to the observed results [34–36]. This is the first study to examine the UGT inhibition effect on systemic levels of bile acids in rats. Since UGTs are involved in the glucuronidation of important endogenous molecules like thyroxine, oestrogen, androgens, bilirubin, and bile acids, changes in their levels due to altered metabolism by xenobiotics can cause clinically significant outcomes in the patients under their treatment. Preference should be given to such research, at least for important disease-modifying endobiotic homeostasis at the drug discovery and development phase. This could preferentially predict or prevent adverse reactions mediated by drugs during clinical studies of drug development. Thus, appropriate labeling or dose adjustments can be made prior to marketing the drug products.
CONCLUSION
In conclusion, in vitro and in vivo results confirmed that Zafirlukast was capable of inhibiting UGT1A1/UGT1A3 enzymes and can be used as a research tool in further applications where UGT inhibition is required to explore key mechanisms in xenobiotic metabolism or disease conditions. We examined the effect of UGT1A1/UGT1A3 enzyme inhibition by Zafirlukast (a pan-UGT inhibitor) on the systemic levels of bilirubin and seven bile acids in a rat model. Once-daily dosing of Zafirlukast for 7 days altered the plasma levels of some bile acids. The concentrations of CA and CDCA were reduced significantly in plasma. However, the plasma levels of DCA, GDCA, TDCA, and Tα/β-MCA remained unaffected. Interestingly, the serum bilirubin was not affected even though Zafirlukast is a potent UGT1A1 inhibitor. These results indicate that either inhibition or induction of UGTs by drug candidates may potentially alter the levels of bile acids, which can result in clinically significant outcomes. Therefore, it is important to evaluate such kinds of DEIs to understand the effect of drugs on the metabolic fate and homeostasis of endogenous molecules.
ACKNOWLEDGMENTS
The authors would like to thank the Central Animal Facility, BITS-Pilani, Hyderabad Campus.
AUTHOR CONTRIBUTIONS
All authors made substantial contributions to conception and design, acquisition of data, or analysis and interpretation of data; took part in drafting the article or revising it critically for important intellectual content; agreed to submit to the current journal; gave final approval of the version to be published; and agree to be accountable for all aspects of the work. All the authors are eligible to be an author as per the International Committee of Medical Journal Editors (ICMJE) requirements/guidelines.
FINANCIAL SUPPORT
There is no funding to report.
CONFLICTS OF INTEREST
The author reports no financial or any other conflicts of interest in this work.
ETHICAL APPROVALS
Ethical Approvals details are given in the ‘Materials and Method section’.
DATA AVAILABILITY
All data generated and analyzed are included in this research article.
PUBLISHER’S NOTE
All claims expressed in this article are solely those of the authors and do not necessarily represent those of the publisher, the editors and the reviewers. This journal remains neutral with regard to jurisdictional claims in published institutional affiliation.
USE OF ARTIFICIAL INTELLIGENCE (AI)-ASSISTED TECHNOLOGY
The authors declares that they have not used artificial intelligence (AI)-tools for writing and editing of the manuscript, and no images were manipulated using AI.
REFERENCES
1. Sheweita SA. Drug-metabolizing enzymes mechanisms and functions. Curr Drug Meta. 2000;1(2):107–32. CrossRef
2. Di L. The role of drug metabolizing enzymes in clearance. Expert Opin Drug Meta Toxicol. 2014;10(3):379–93. CrossRef
3. Muntane J. Regulation of drug metabolism and transporters. Curr Drug Metab. 2009;10(8):932–45. CrossRef
4. Krishnaswamy S, Duan SX, Von Moltke LL, Greenblatt DJ, Court MH. Validation of serotonin (5-hydroxtryptamine) as an in vitro substrate probe for human UDP-glucuronosyltransferase (UGT) 1A6. Drug Meta Dispos. 2003;31(1):133–39. CrossRef
5. Wang PC, Kuchel O, Buu NT, Genest J. Catecholamine glucuronidation: an important metabolic pathway for dopamine in the rat. J Neurochem. 1983;40(5):1435–40. CrossRef
6. Guillemette C, Bélanger A, Lépine J. Metabolic inactivation of estrogens in breast tissue by UDP-glucuronosyltransferase enzymes: an overview. Breast Cancer Res. 2004;6(6):246. CrossRef
7. Bock KW. Roles of human UDP-glucuronosyltransferases in clearance and homeostasis of endogenous substrates, and functional implications. Biochem Pharmacol. 2015;96(2):77–82. CrossRef
8. Zhang D, Chando TJ, Everett DW, Patten CJ, Dehal SS, Humphreys WG. In vitro inhibition of UDP glucuronosyltransferases by atazanavir and other HIV protease inhibitors and the relationship of this property to in vivo bilirubin glucuronidation. Drug Metab Dispos. 2005;33(11):1729–39. CrossRef
9. Findlay KAB, Kaptein E, Visser TJ, Burchell B. Characterization of the uridine diphosphate-glucuronosyltransferase-catalyzing thyroid hormone glucuronidation in Man1. J Clin Endocrinol Meta. 2000;85(8):2879–83. CrossRef
10. Hirashima R, Michimae H, Takemoto H, Sasaki A, Kobayashi Y, Itoh T, et al. Induction of the UDP-glucuronosyltransferase 1A1 during the perinatal period can cause neurodevelopmental toxicity. Mol Pharmacol. 2016;90(3):265–74. CrossRef
11. Dawson PA, Karpen SJ. Intestinal transport and metabolism of bile acids. J Lipid Res. 2015;56(6):1085–99. CrossRef
12. Barbier O, Trottier J, Kaeding J, Caron P, Verreault M. Lipid-activated transcription factors control bile acid glucuronidation. Mol Cell Biochem. 2009;326(1–2):3–8. CrossRef
13. Trottier J, Perreault M, Rudkowska I, Levy C, Dallaire-Theroux A, Verreault M, et al. Profiling serum bile acid glucuronides in humans: gender divergences, genetic determinants, and response to fenofibrate. Clin Pharmacol Ther. 2013;94(4):533–43. CrossRef
14. McGlone ER, Bloom SR. Bile acids and the metabolic syndrome. Ann Clin Biochem. 2019;56(3):326–37. CrossRef
15. Fuchs CD, Trauner M. Role of bile acids and their receptors in gastrointestinal and hepatic pathophysiology. Nat Rev Gastroenterol Hepatol. 2022;19(7):432–50. CrossRef
16. Hegade VS, Speight RA, Etherington RE, Jones DE. Novel bile acid therapeutics for the treatment of chronic liver diseases. Ther Adv Gastroenterol. 2016;9(3):376–91. CrossRef
17. Mullapudi TVR, Ravi PR, Thipparapu G. UGT1A1 and UGT1A3 activity and inhibition in human liver and intestinal microsomes and a recombinant UGT system under similar assay conditions using selective substrates and inhibitors. Xenobiotica. 2021;51(11):1236–46. CrossRef
18. Mullapudi TVR, Ravi PR, Thipparapu G. Simultaneous determination of seven bile acids to study the effect of ivermectin on their plasma levels in rat by UHPLC–MS/MS. J Anal Sci Technol. 2023;14(1):44. CrossRef
19. Jansen PLM, Mulder GJ, Burchell B, Bock KW. New developments in glucuronidation research: Report of a workshop on “Glucuronidation, its role in health and disease.” Hepatology. 1992;15(3):532–44. CrossRef
20. Wells PG, Mackenzie PI, Chowdhury JR, Guillemette C, Gregory PA, Ishii Y, et al. Glucuronidation and the UDP-glucuronosyltransferases in health and disease. Drug Metab Dispos. 2004;32(3):281–90. CrossRef
21. Xiao L, Zhang Z, Luo X. Roles of xenobiotic receptors in vascular pathophysiology. Circ J. 2014;78(7):1520–30. CrossRef
22. Rakateli L, Huchzermeier R, van der Vorst EPC. AhR, PXR and CAR: from xenobiotic receptors to metabolic sensors. Cells. 2023;12(23):2752. CrossRef
23. Li H, Wang H. Activation of xenobiotic receptors: driving into the nucleus. Expert Opin Drug Metab Toxicol. 2010;6(4):409–26. CrossRef
24. Bigo C, Caron S, Dallaire-Théroux A, Barbier O. Nuclear receptors and endobiotics glucuronidation: the good, the bad, and the UGT. Drug Meta Rev. 2013;45(1):34–47. CrossRef
25. Erichsen TJ, Aehlen A, Ehmer U, Kalthoff S, Manns MP, Strassburg CP. Regulation of the human bile acid UDP-glucuronosyltransferase 1A3 by the farnesoid X receptor and bile acids. J Hepatol. 2010;52(4):570–8. CrossRef
26. Trottier J, Verreault M, Grepper S, Monté D, Bélanger J, Kaeding J, et al. Human UDP-glucuronosyltransferase (UGT)1A3 enzyme conjugates chenodeoxycholic acid in the liver. Hepatology. 2006;44(5):1158–70. CrossRef
27. Modica S, Gadaleta RM, Moschetta A. Deciphering the nuclear bile acid receptor FXR paradigm. Nucl Recept Signal. 2010;8:e005. CrossRef
28. Jiang L, Zhang H, Xiao D, Wei H, Chen Y. Farnesoid X receptor (FXR): Structures and ligands. Comput Struct Biotechnol J. 2021;19:2148–59. CrossRef
29. Mahmoud HM, Elsayed Abouzed DE, Abo-Youssef AM, Hemeida RAM. Zafirlukast protects against hepatic ischemia-reperfusion injury in rats via modulating Bcl-2/Bax and NF-kappaB/SMAD-4 pathways. Int Immunopharmacol. 2023;122:110498. CrossRef
30. Li YQ, Prentice DA, Howard ML, Mashford ML, Desmond PV. Bilirubin and bile acids may modulate their own metabolism via regulating uridine diphosphate-glucuronosyltransferase expression in the rat. J Gastroenterol Hepatol. 2000;15(8):865–70. CrossRef
31. van der Schoor LWE, Verkade HJ, Bertolini A, de Wit S, Mennillo E, Rettenmeier E, et al. Potential of therapeutic bile acids in the treatment of neonatal hyperbilirubinemia. Sci Rep. 2021;11(1):11107. CrossRef
32. Sugatani J. Function, genetic polymorphism, and transcriptional regulation of human UDP-glucuronosyltransferase (UGT) 1A1. Drug Metab Pharmacokinet. 2013;28(2):83–92. CrossRef
33. Oda S, Fujiwara R, Kutsuno Y, Fukami T, Itoh T, Yokoi T, et al. Targeted screen for human UDP-glucuronosyltransferases inhibitors and the evaluation of potential drug-drug interactions with zafirlukast. Drug Metab Dispos. 2015;43(6):812–8. CrossRef
34. Schierle S, Helmstädter M, Schmidt J, Hartmann M, Horz M, Kaiser A, et al. Dual farnesoid X receptor/soluble epoxide hydrolase modulators derived from zafirlukast. ChemMedChem. 2020;15(1):50–67. CrossRef
35. Gobel T, Diehl O, Heering J, Merk D, Angioni C, Wittmann SK, et al. Zafirlukast is a dual modulator of human soluble epoxide hydrolase and peroxisome proliferator-activated receptor gamma. Front Pharmacol. 2019;10:263. CrossRef
36. Gelzinis JA, Szahaj MK, Bekendam RH, Wurl SE, Pantos MM, Verbetsky CA, et al. Targeting thiol isomerase activity with zafirlukast to treat ovarian cancer from the bench to clinic. FASEB J. 2023;37(5):e22914. CrossRef
SUPPLEMENTARY MATERIAL
The supplementary material can be accessed at the link here: [https://japsonline.com/admin/php/uploadss/4596_pdf.pdf]