Research Article | Volume: 15, Issue: 6, June, 2025

A quality by design approach with comprehensive green analytical chemistry assessment: Development, validation, and application of a high-performance liquid chromatographic method for quantifying meropenem trihydrate in nanosponges and marketed formulations

Ashwini T Sanjay Garg Padmaja A. Shenoy Raghu Chandrashekhar Yogendra Nayak Usha Y. Nayak   

Open Access   

Published:  May 05, 2025

DOI: 10.7324/JAPS.2025.236517
Abstract

Meropenem trihydrate (MPN), pivotal in antimicrobial therapeutics, necessitates accurate analytical methods for its quantification across pharmaceutical formulations. The research aimed to develop a Quality by Design (QbD)-driven high-performance liquid chromatography (HPLC) method and validate it for the quantification of MPN in traditional and novel formulations, with a focus on environmental sustainability. The study employed a QbD approach to develop an HPLC method, ensuring its robustness and adaptability. The method’s universality was evaluated in both traditional powders for injection formulation and a novel beta-cyclodextrin nanosponges formulation. Rigorous validation was conducted per the International Conference on Harmonisation Q2 (R1) guidelines, including extensive stability and degradation studies to ascertain the method’s tenacity under multifarious conditions. The QbD-driven HPLC method showcased impeccable precision and accuracy, with a recovery rate of 99% for the marketed product and an encapsulation efficiency of 88.7% for nanosponges. Furthermore, seven different green analytical chemistry tools were used, and they indicated a significant reduction in environmental impact compared to pre-existing methodologies. In conclusion, our QbD-driven HPLC method for MPN quantification melds technical prowess with environmental responsibility, signifying a noteworthy stride in pharmaceutical research. The method’s high precision and stability assessment provide clinicians with a reliable tool for ensuring accurate dosing in critically ill patients, ultimately enhancing therapeutic efficacy and reducing treatment failure risks. Furthermore, the method supports sustainable drug analysis, minimizing ecological hazards associated with pharmaceutical waste. The method’s adaptability and greenness set a benchmark for future analytical methodologies, emphasizing analytical rigor, and ecological conscientiousness.


Keyword:     High-performance liquid chromatographic method meropenem trihydrate quality by design nanosponge formulation green analytical chemistry


Citation:

Ashwini T, Garg S, Shenoy PA, Chandrashekhar R, Nayak Y, Nayak UY. A quality by design approach with comprehensive green analytical chemistry assessment: Development, validation, and application of a high-performance liquid chromatographic method for quantifying meropenem trihydrate in nanosponges and marketed formulations. J Appl Pharm Sci. 2025;15(06):070–095. http://doi.org/10.7324/JAPS.2025.236517

Copyright: © The Author(s). This is an open-access article distributed under the Creative Commons Attribution License, which permits unrestricted use, distribution, and reproduction in any medium, provided the original work is properly cited.

HTML Full Text

INTRODUCTION

The global healthcare landscape grapples with chronic bacterial infections, resulting in prolonged patient suffering and inflated healthcare expenses. These infections profoundly impact patients’ quality of life and necessitate effective treatment strategies [1,2]. In 2017 and 2019, the Indian Council of Medical Research reported several pathogens that were found to be responsible for such maladies. These findings have been corroborated by the World Health Organization and the Center for Disease Control and Prevention, signifying the escalating necessity to address this global health threat [25].

Among the arsenal of antibiotics utilized to combat chronic bacterial infections, meropenem trihydrate (MPN) is a broad-spectrum and last-resort antibiotic option [6]. Its effectiveness against a vast range of bacteria designates it as an invaluable therapeutic agent for managing severe infections. Currently, MPN is marketed as an intravenous formulation with various doses in the treatment regimen. However, the quest for optimization has driven research toward nanoformulations such as meropenem-loaded solid lipid nanoparticles [7], liposomes [8], and mesoporous silica nanoparticles [6]. These innovations promise enhanced drug delivery and heightened treatment efficacy [9,10].

The accurate and precise quantification of MPN in dosage forms is paramount for elucidating its dose-dependent therapeutic action. Various analytical methods have been reported for MPN quantification, including ultraviolet (UV) spectrometry [11], high-performance liquid chromatography-ultraviolet spectrometry (HPLC-UV) [1115], and liquid chromatography-mass spectrometry (LC-MS) [15,16]. Despite the availability of these methodologies, high-performance liquid chromatography (HPLC) with UV detection is often the preferred choice for quantifying drugs in pharmaceutical formulations, credited for its rapidness, robustness, reliability, selectivity, and sensitivity, which surpass traditional UV techniques [1719]. Additionally, the lower cost and simpler instrumentation of HPLC-UV compared to LC-MS make it more accessible for a wide range of analytical laboratories. Therefore, we used the HPLC-UV method in the current investigation to quantify MPN [11,12]. However, a review of the literature reveals significant limitations within reported methods for estimating MPN. These shortcomings include poor sensitivity [14,20,21], excessive use of organic solvents that are not environmentally friendly and lead to high analysis costs [14,2022], long run times that render the process time-intensive [11,2325], complex method of elution [2628], complicated mobile phase preparations [29], the complex and costly use of detectors such as mass spectrometry [2628], incomplete method validation [14,2028,3033], and a notable absence of a reliable analytical HPLC method for the estimation of MPN. The reported analytical methods are lacking in providing comprehensive details of the impact of various factors as well as the interaction effect of factors on responses [11,14,2030,3133]. Additionally, there is a dearth of methods for quantifying the MPN in the marketed formulation and novel nanoformulation (nanosponges). Hence, the pressing need remains to develop a robust and validated HPLC-UV analytical method to quantify MPN in pharmaceutical formulations. The detailed drawbacks of existing methods are summarized in Table 1 below, highlighting the novelty and necessity of this study to address the gaps in current research and methodology.
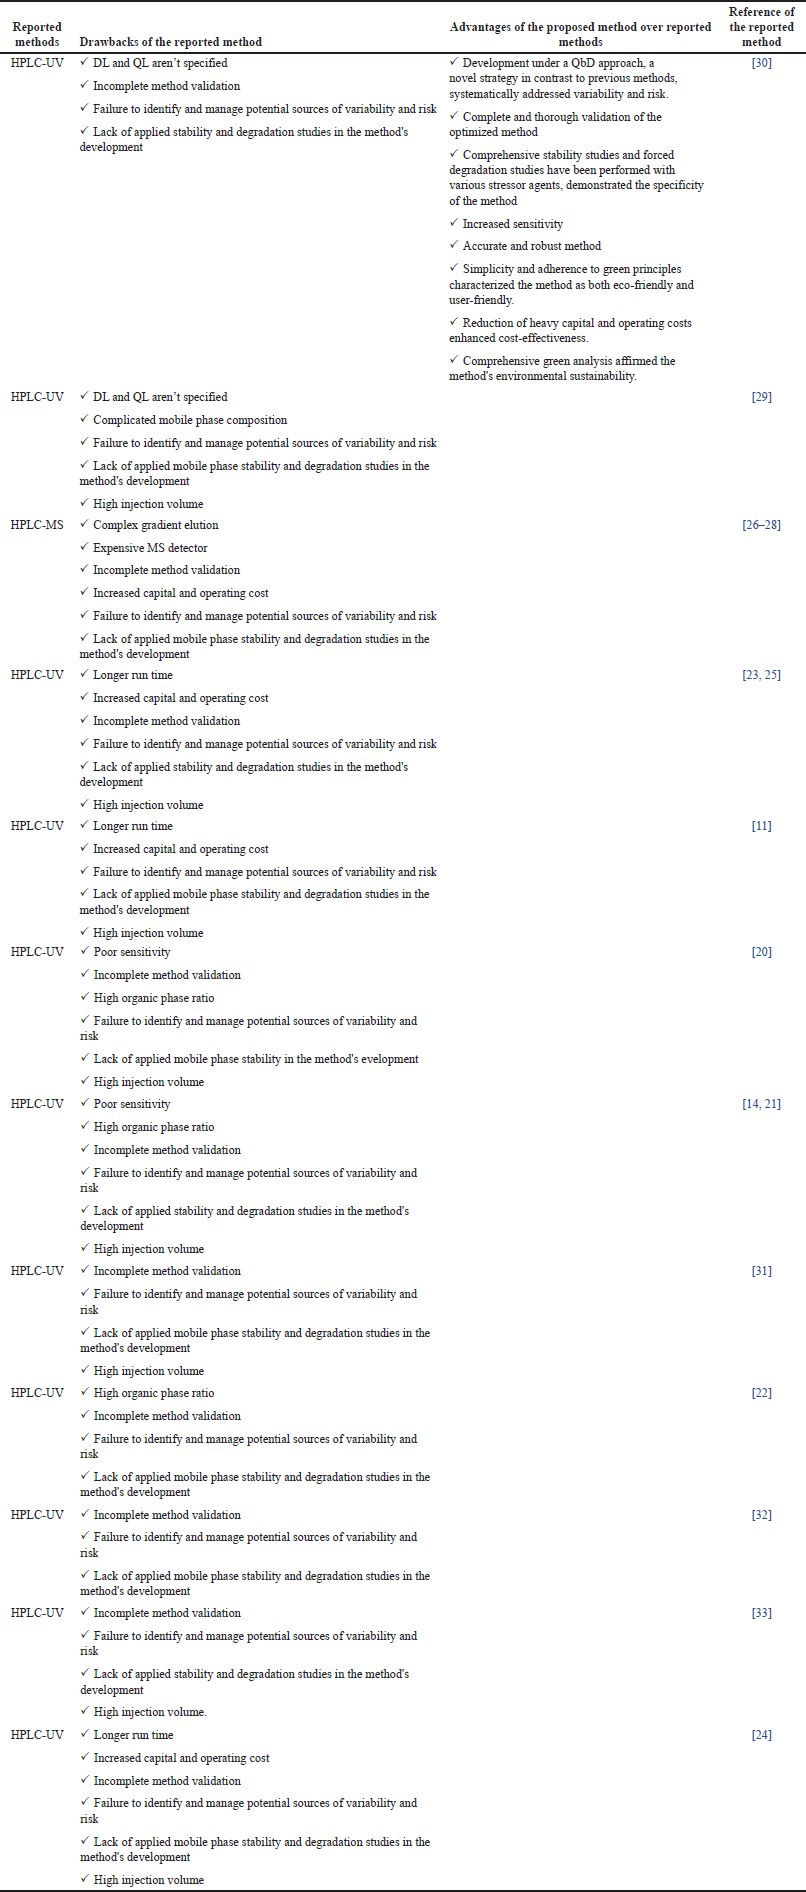
Table 1. Comparison of the proposed analytical method with reported methods.

[Click here to view]

Systematic evaluation of factors affecting analytical method performance is essential but challenging. This study employs a quality by design (QbD) approach to method development, focusing on identifying and controlling critical factors to ensure robustness, reliability, accuracy, and precision. The QbD approach also minimizes variability and enhancing method performance [3437]. The objective is to develop an HPLC-UV method for quantifying MPN in pharmaceutical formulations using this systematic framework.

This study also examines the stability and degradation behavior of MPN under stress conditions to identify degradation pathways and stability concerns, ensuring the safety and efficacy of pharmaceutical formulations. Additionally, it addresses gaps in the literature by analyzing MPN quantification in marketed formulations and innovative nanosponges.

Growing awareness of environmental impacts from chemicals underscores the need for sustainable practices aligned with the United Nations’ Sustainable Development Goals (SDGs), particularly SDG 12: “Responsible Consumption and Production”. These efforts also support SDG 3: “Good Health and Well-being” and SDG 14: “Life Below Water” by minimizing harmful chemical effects, and driving eco-friendly analytical methodologies [38,39].

Green analytical chemistry (GAC) promotes sustainable analytical practices that balance accuracy, robustness, and environmental stewardship [40,41]. This paradigm shift prioritizes energy efficiency, waste reduction, and minimal environmental impact in liquid chromatography, aligning with SDG 12 and related goals. Advanced greenness evaluative tools, from Analytical Eco-Scale (AES) to the analytical greenness (AGREE) calculator, provide comprehensive assessments of analytical methods, supporting a synergistic evaluation approach [42,43]. Our developed method was compared against the existing analytical methods (“reported method with most citations in Scopus” [11] and the “latest reported method available in Scopus” [14]). These methods were chosen due to their widespread acclaim and the most up-to-date information available in the scientific community. By juxtaposing our developed method with these highly regarded counterparts, we aimed to demonstrate its sustainable essence and competitive prowess within existing analytical approaches.

This research advances analytical methodologies for MPN quantification, providing insights into its stability and degradation behavior. Our greenness assessment highlights the method’s minimal environmental impact, achieved through advanced tools, and sustainable practices. These efforts contribute to developing MPN-based formulations for chronic bacterial infections while promoting eco-friendly analytical research.


MATERIALS

MPN (purity ≥98%) was procured from Sigma Aldrich. The buffer salts utilized in this research, including ammonium acetate (purity ≥97%), ammonium formate (purity 97%), and sodium acetate (purity ≥99%), were procured from Merck Life Science Pvt. Ltd. (Mumbai, India). Potassium dihydrogen phosphate (purity, min. 99%) was from Himedia Labs Pvt. Ltd. (Mumbai, India), and sodium hydroxide pellets (purity, min. 97%) were from Finar Ltd. (Gujarat, India). The HPLC-grade solvents of acetonitrile (purity, min 99.9%), hydrochloric acid (37%), hydrogen peroxide (30%), glacial acetic acid (100%), and orthophosphoric acid (purity, min 85%) were procured from Merck Life Science Pvt. Ltd. (Mumbai, India). Methanol (purity, min. 99.80%), triethylamine LR (purity, min. 99.00%), and formic acid (purity, 85%) were purchased from Finar Ltd. (Gujarat, India). Beta-cyclodextrin (β-CD) was procured as ex-gratis from Ashland, India, and diphenyl carbonate (DPC) was purchased from Spectrochem, Pvt. Ltd. (Mumbai, India) for nanosponges preparation. Ferric chloride (purity ≥99%) and acetone (purity, 99% min) were procured from Merck Life Science Pvt. Ltd. (Mumbai, India).


INSTRUMENTATION

The present research study employed the LC-2010C HT, a HPLC instrument manufactured by Shimadzu, Japan. This advanced device is equipped with a dual-wavelength UV detector, a column oven, and an autosampler, all provided by Shimadzu. To record and analyze the chromatographic data, LC Solution software version 5.57 was utilized. The various analytical columns used are Kinetex C18 (250 mm*4.6 mm*5 μ) column from Phenomenex, USA; Hyperclone C18 (250 mm*4.6 mm*5 μ) column from Phenomenex; Chromasol Jade C18 (250 mm*4.6 mm*5 μ) column from Intek; and Chromasol Onyx C18 (250 mm*4.6 mm*5 μ) column from Intek.

The mobile phase was filtered through a 0.22-micron cellulose nitrate membrane using a Millipore glass vacuum filtration unit and sonicated for 10 minutes in a GT Sonic Ultrasonic Cleaner (Servewell Instruments, India). pH measurements were performed with a Systronics Micro-Controller-based pH system 361, ensuring precise control.


METHOD DEVELOPMENT

QbD approach

The study adopted the Analytical QbD framework to develop a robust and reproducible HPLC-UV method for estimating MPN in marketed and nanosponges formulations, aligning with International Conference on Harmonisation (ICH) Q2(R1), Q8(R2), and Q14 guidelines [4446].

Defining the analytical target profile (ATP) and determining critical performance attributes (CPAs)

The ATP was defined to ensure method performance. CPAs were identified based on prior knowledge, literature review, and preliminary trials [35].

Risk assessment

A systematic risk assessment was performed to evaluate the impact of Critical Method Attributes (CMAs) and Critical Procedure Parameters (CPPs) on CPA. This risk assessment was conducted using an Ishikawa Fishbone Diagram (Fig. 1) to identify potential risks associated with method and procedure attributes. Preliminary trials conducted using a one-factor-at-a-time (OFAT) design, allowed for the identification of critical factors affecting method performance [47].
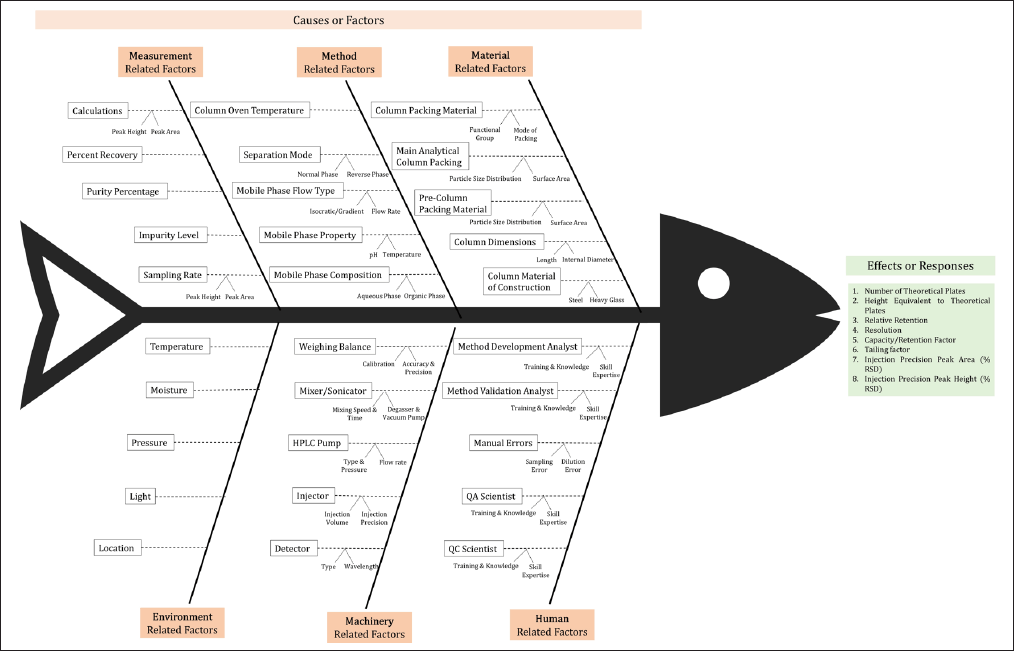
Figure 1. Identification of risk factors by the Ishikawa Fishbone diagram.

[Click here to view]

Preparation of the mobile phase and standard solutions

The mobile phase was prepared by dissolving HPLC-grade ammonium acetate in 1,000 ml of MilliQ water and adjusting to the desired pH of 5.1. A 1,000 μg/ml standard stock solution of MPN was prepared by dissolving 10 mg of MPN in the mobile phase, with subsequent dilutions to achieve the required concentrations.

Design of experiments (DoEs)

DoE principles were applied to optimize CMAs and CPPs. Screening and optimization experiments were conducted to evaluate the effect of independent factors on dependent variables using Design-Expert software (v9.0.5.1, Stat-Ease Inc., USA).

Screening of independent factors using fractional factorial design

A two-level fractional factorial design (2V5-1) with three center points and triplicates was employed to screen five independent factors (Table 2) based on their main and interaction effects. The design suggested 51 experiments, enabling efficient factor prioritization. Factor levels were chosen based on literature and preliminary studies [48].
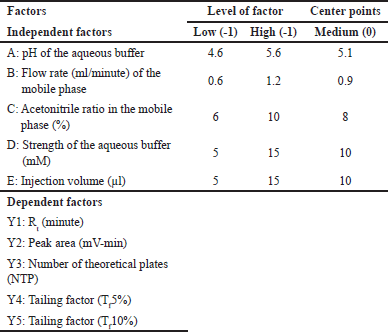
Table 2. Independent factors with its level, center points, and their dependent factors in 2V (5-1) fractional factorial design.

[Click here to view]

Optimization of factors using Box-Behnken design

Following the screening phase, the three most significant factors were optimized using the Box-Behnken design, an economical response surface methodology suitable for optimizing three independent factors. This design estimates the main and second-order interaction effects of input factors on responses with minimal experimentation. The software suggested 12 experiments, and the optimum levels of the factors were identified through these trials.

Development and verification of the method operable design region (MODR)

The MODR defines a flexible multidimensional space where the interaction of independent factors ensures minimal variability [35]. MODR was established through numerical optimization, with specified limits for all individual responses.

Numerical optimization identified the optimal solution with the highest desirability score. The MODR was further validated through three confirmatory experimental runs, and the results were consistent with model-predicted values.


VALIDATION OF THE OPTIMIZED HPLC METHOD

Validation was conducted according to ICH Q2(R1) guidelines to assess the method’s performance for its intended use [49].

Specificity

Specificity was evaluated by injecting replicates of blank (diluent), MPN standard (5 μg/ml), marketed formulation (equivalent to 10 μg/ml of MPN), placebo, and novel nanosponges formulation (equivalent to 10 μg/ml of MPN). Chromatograms were analyzed for potential interference from excipients or diluents at MPN’s retention time (Rt).

Linearity

The method’s linearity was tested using MPN concentrations of 0.1, 0.25, 0.5, 1, 2.5, 5, 7.5, 10, and 12.5 μg/ml. Each concentration was injected in quintuplicate, and a linear regression graph was plotted between the concentration (μg/ml) and peak area (mV-min). The regression equation’s slope and intercept were calculated [50].

Accuracy and precision

Accuracy was assessed by injecting three concentrations (4, 5, and 6 μg/ml) in sextuplicate. It was evaluated by analyzing these concentrations, and the mean percentage recovery was calculated for each concentration [50].

Precision was assessed using four quality control (QC) concentrations: quantitation limit (QL), lower QC (3× QL), middle QC (average of lower and higher QC), and higher QC (70% of the highest linearity concentration). Intra-day precision was evaluated by analyzing sextuplicates of the QC concentrations at two different time points within the same day (09:00 and 21:00). Inter-day precision was assessed by performing duplicate injections of the QC concentrations over three consecutive days. For both intra-day and inter-day analyses, the peak area and percentage relative standard deviation (%RSD) were calculated to determine precision.

Statistical comparison with a reported method to validate our method’s performance, we compared it with the previously reported method by Mendez et al. [11] using two statistical tests [11].

Comparison of method precision (F-test)

The F-test was used to compare how precise both methods are by comparing their variations in measurements. This tcresults than the other.

Comparison of method accuracy (t-test)

Student’s t-test was used to compare the accuracy between both methods by comparing their mean recovery values. This helps determine if both methods give similar results when measuring the same thing. Both statistical tests were performed at a 95% confidence level. If the calculated values were less than the critical values from standard statistical tables, it would indicate no significant difference between the methods.

Sensitivity

The detection limit (DL) and QL were calculated using the following formulas:

DL = 3 . 3 * σ S

QL = 1 0 * σ S

where σ = the residual standard deviation of the regression line

S = slope of the regression line.

Robustness

Robustness was evaluated by analyzing the impact of minor variations in experimental conditions (Table 3). An MPN concentration of 5 μg/ml was injected thrice under altered conditions, and parameters such as peak area, Rt, Tf5%, Tf10%, and NTP were monitored for %RSD.

Table 3. Different conditions for robustness studies.

[Click here to view]

System suitability

System suitability was confirmed by injecting 5 μg/ml of MPN in sextuplicate. Parameters such as peak area, Rt, Tf5%, Tf10%, and NTP were calculated along with %RSD to ensure the system met the required criteria.


BENCHTOP STABILITY STUDIES OF THE MPN SOLUTION

The stability and degradation studies for MPN were conducted to evaluate its behavior under various conditions. Benchtop stability of the MPN solution was assessed using two concentrations, 4.59 μg/ml (lower QC) and 8.75 μg/ml (higher QC). Fresh solutions were prepared and stored at ambient temperature over three days, labeled D1, D2, and D3. On Day 3, all solutions were analyzed in triplicate. The mean peak areas of D1 (48 hours old) and D2 (24 hours old) were compared to D3 (freshly prepared) to calculate the percentage stability and similarity indices.

Similarity index for 48 hours stability = Mean peak area of D 1 × Amount of D 3 Mean peak area of D 3 × Amount of D 1

Similarity index for 48 hours stability = Mean peak area of D 2 × Amount of D 3 Mean peak area of D 3 × Amount of D 2 .


AUTOSAMPLER POST-OPERATIVE STABILITY STUDIES OF MPN SOLUTION

Autosampler post-operative stability studies were conducted to determine the integrity of MPN stored at 4°C in autosampler vials for 24 hours. The lower and higher QC concentrations were analyzed in triplicate and compared to freshly prepared samples. Stability percentages and similarity indices were calculated based on peak area comparisons [51].

Similarity index for autosampler postoperative stability

= Mean peak area of 24 hour sautosampler stored sample × Amount of fresh sample Mean peak area of fresh sample × Amount of autosampler stored sample

BENCHTOP STABILITY STUDIES OF THE MOBILE PHASE

The benchtop stability of the mobile phase was assessed by preparing and storing it at ambient temperature for three consecutive days (labeled M1, M2, and M3). On Day 3, a 5 μg/ml MPN solution was analyzed using all three mobile phases in triplicate, with M1 (48 hours old) and M2 (24 hours old) compared to M3 (freshly prepared).

Similarity index for 48 hours stability

= Mean peak area of MPN in M 1 × Amount of MPN Mean peak area of MPN in M 3 × Amount of MPN

Similarity index for 24 hours stability

= Mean peak area of MPN in M 2 × Amount of MPN Mean peak area of MPN in M 3 × Amount of MPN


DEGRADATION STUDIES

Degradation studies examined MPN under stress conditions, including acid, alkali, oxidative, and photolytic exposures. Acid-induced degradation was conducted under real-time and accelerated conditions by treating MPN (5 μg/ml) with 0.1 N and 1 N HCl. Samples were stored at ambient temperature for 24 hours or at 60°C for 6 hours, then neutralized with NaOH and analyzed. Alkali-induced degradation was performed similarly, using 0.1 N and 1 N NaOH for treatment and subsequent neutralization with HCl. Oxidative degradation involved treating MPN with 3% H2O2, either stored at ambient temperature for 24 hours or at 60°C for 6 hours, followed by analysis. Photolytic degradation was evaluated by exposing MPN to UV light (direct sunlight) for 24 hours, and the resulting degradation products were analyzed. This comprehensive assessment of MPN’s stability and degradation under varying conditions provides insights into its robustness and suitability for analytical applications [51].


APPLICATION OF THE DEVELOPED ANALYTICAL METHOD FOR QUANTIFICATION OF MPN IN MARKETED PRODUCT AND NOVEL NANOFORMULATIONS

The developed HPLC method is considered a valuable tool only after its practical application to quantify MPN in dosage forms. MPN was analyzed in the marketed powder for injection formulation (Merosure 125 mg, Alkem Laboratories, India) and the novel β-CD nanosponges formulation to test the practical feasibility of the method.

Quantification of MPN in the marketed formulation

The validated method was used to analyze and quantify the MPN in the marketed powder for injection formulation. The marketed formulation’s standard stock solution was prepared by accurately weighing 5.45 mg (equivalent to 5 mg of MPN), transferring it to a 10 ml volumetric flask, and filling the volume with the mobile phase at a final concentration of 500 μg/ml. Further dilutions were done with the mobile phase to obtain the desired concentration (10 μg/ml). The validated method was used to analyze the desired concentration, and the Rt and peak area were measured. The amount of MPN in the desired concentration was calculated by comparing the peak area [35].

Quantification of MPN in β-CD-nanosponges

Preparation of β-CD cross-linked nanosponges

β-CD nanosponges were prepared using the melt method, involving a cross-linking reaction between β-CD and DPC in a 1:4 weight ratio. The homogenously triturated mixture was reacted for 5 hours at 100°C and left overnight at ambient temperature. The resulting cross-linked nanosponges were purified via Soxhlet extraction using acetone, and the phenol by-product was removed. The purified nanosponges were dried at 50°C and tested with 1% ferric chloride solution to ensure phenol-free purity, resulting in a pure white powder stored at 25°C for future use [52].

Preparation of MPN encapsulated β-CD-nanosponges

MPN encapsulation into nanosponges was achieved using a solvent immersion technique. A 1:1 ratio of MPN and nanosponges was used, where the nanosponges were dispersed in water and sonicated with a probe sonicator (20% amplitude for 10 minutes with 2-second breaks every 10 seconds). MPN was then added to the dispersion, stirred for 6 hours, and centrifuged at 2,500 rpm for 10 minutes. The colloidal supernatant containing drug-encapsulated nanosponges was collected, freeze-dried, and stored for further analysis [52].

Encapsulation efficiency

To determine encapsulation efficiency, MPN-encapsulated nanosponges were weighed and dispersed in methanol, followed by sonication to break the nanosponges. The sonicated mixture was centrifuged, and the supernatant was diluted with the mobile phase for HPLC analysis. The Rt and peak areas were recorded, and the amount of MPN was calculated by comparing the peak areas with the standard. Encapsulation efficiency was calculated using the below-mentioned formulas [52].

Encapsulation efficiency = Entrapped amount of drug × 100 Total amount of drug added


STATISTICAL ANALYSIS

All the data obtained from the experiments were subjected to statistical analysis. Results are presented as mean values and their respective % RSD. Statistical significance was determined at a 95% confidence level.


RESULT AND DISCUSSION

Defining an ATP and determining CPAs

The ATP was established to ensure a robust and reliable HPLC-UV method for quantifying MPN, addressing systematic and inherent variability while ensuring system suitability. As part of the QbD approach, CPAs were identified to significantly impact the method’s performance. They are (a) Rt (min), (b) peak area (mV-min), (c) tailing factor, and (d) number of theoretical plates.

Risk assessment

A risk assessment was conducted using an Ishikawa fishbone diagram to identify the CMAs and CPPs that could influence the analytical method. Preliminary trials (Table 4), based on an OFAT design, were conducted, and the variables such as buffer pH, flow rate, acetonitrile ratio in the mobile phase, buffer strength, and injection volume were identified as critical based on their significant impact on method performance.
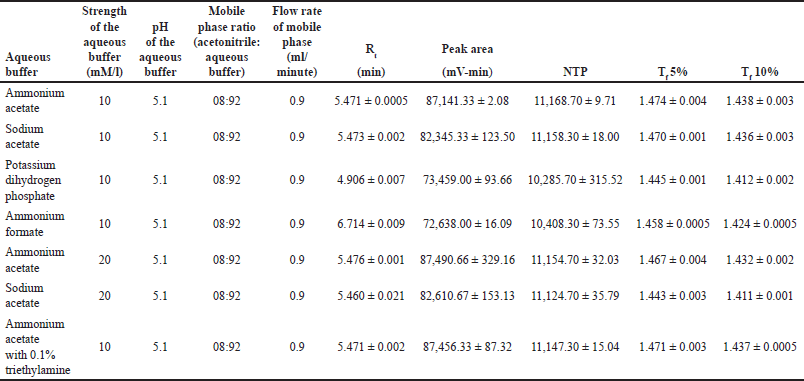
Table 4. Preliminary trial for the identification of risk factors.

[Click here to view]

Selection of the mobile phase

Acetonitrile was chosen as the organic mobile phase because it has a higher vapor pressure than methanol and a lower internal pressure in the column, leading to better efficiency and column lifetime. The aqueous mobile phase composition was optimized by evaluating the buffer type, pH, and concentration. Considering MPN’s pKa values (2.9 and 7.4), a buffer pH of 5.1 was selected to maintain the drug in a consistent ionized or unionized state without compromising the silica column integrity.

Four buffer systems (ammonium acetate, ammonium formate, sodium acetate, and potassium dihydrogen phosphate) were screened at a concentration of 10 mM with a mobile phase ratio of 92:08 (aqueous:organic). Ammonium acetate demonstrated superior performance, yielding a peak area of 87,141.33 ± 2.08 mV-min and 11,168.70 ± 9.71 theoretical plates, compared to sodium acetate with 82,345.33 ± 123.50 mV-min and 11,158.30 ± 18.00 theoretical plates.

Selection of the stationary phase

In continuation of the OFAT design, various stationary phases, including the Phenomenex Kinetex C18 (250 mm*4.6 mm*5 μ) column, Phenomenex Hyperclone C18 (250 mm*4.6 mm*5 μ) column, Intek Chromasol Jade C18 (250 mm*4.6 mm*5 μ) column, and Intek Chromasol Onyx C18 (250 mm*4.6 mm*5 μ) column, were screened.

Acetonitrile and 10 mM ammonium acetate in a ratio of 8:92 were used in the preliminary trials for the stationary phase selection. An MPN concentration of 5 μg/ml was prepared and analyzed in the four stationary phases.

Among the four stationary phases, the Phenomenex Kinetex C18 column significantly showed consistent results with a better peak area, and therefore, it was selected as the ideal stationary phase for the method development.

Design of experiments

Screening of independent factors using fractional factorial design

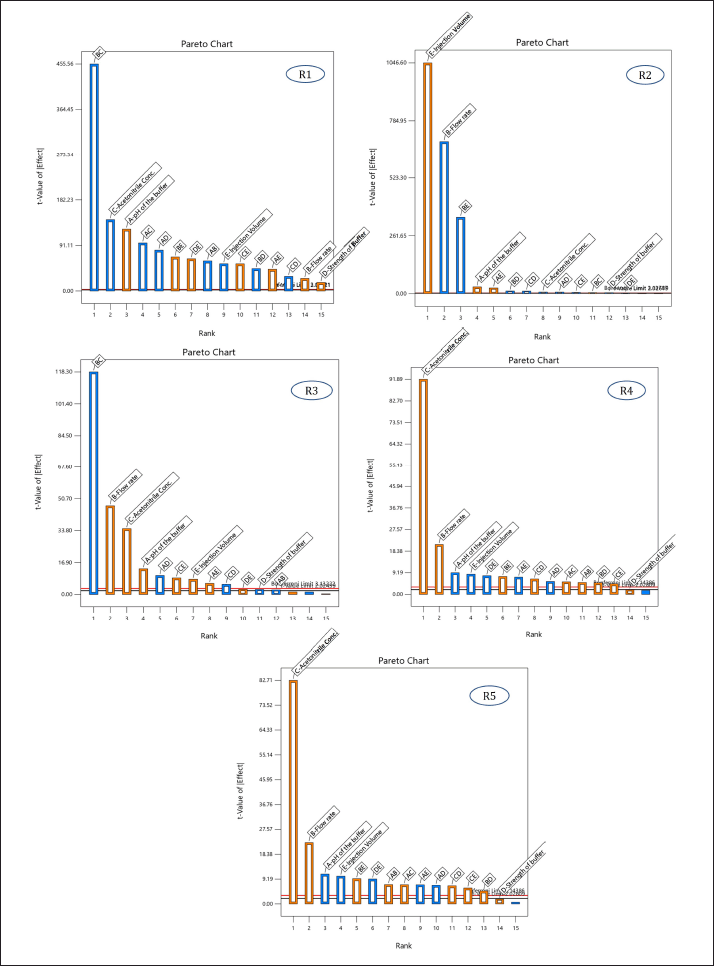
Screening of 5 independent factors [Factor A: pH of the buffer; Factor B: flow rate; Factor C: acetonitrile ratio in the mobile phase; Factor D: strength of the buffer; and Factor E: injection volume] was carried out using a fractional factorial design. Dependent responses were measured for all experimental runs, as tabulated in Table 5, and the relationship between factors and their respective responses was analyzed using graphical effects analysis, specifically Pareto charts (Fig. 2).
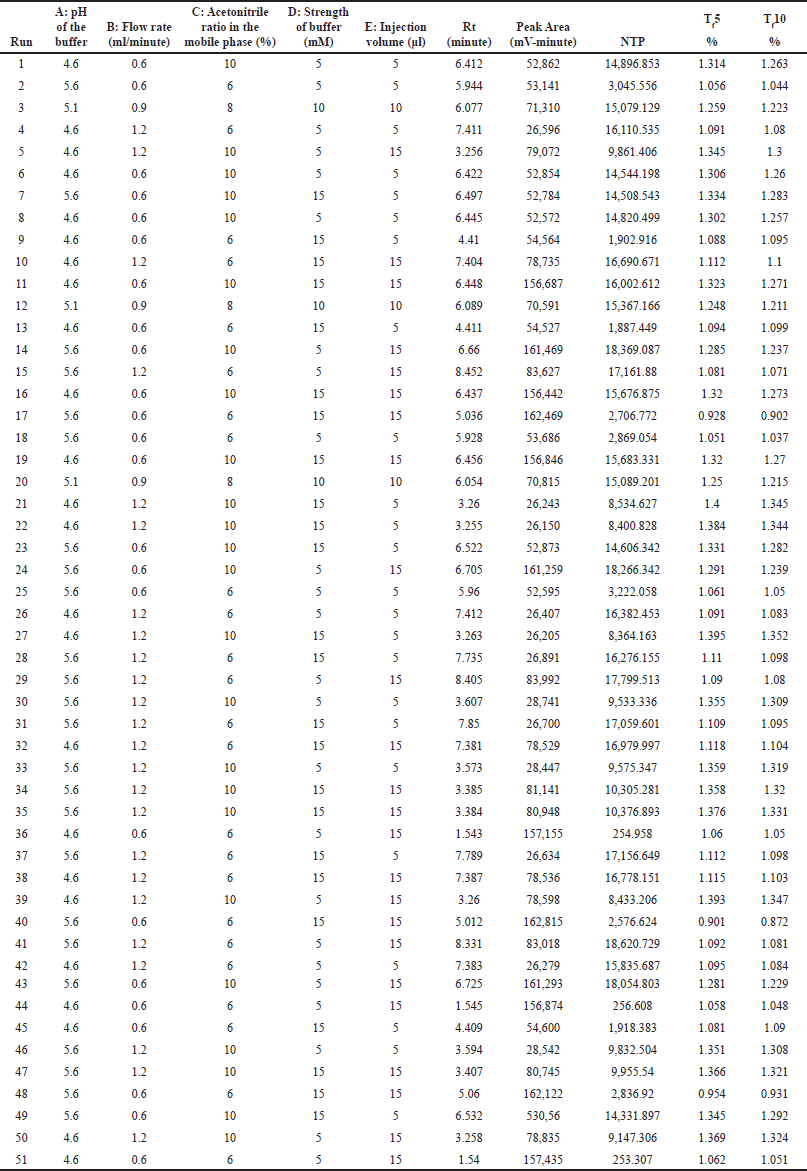
Table 5. Experimental runs and their results based on fractional factorial design.

[Click here to view]
Figure 2. Pareto chart illustrating the effect of independent variables [(A) pH of the buffer, (B) flow rate, (C) acetonitrile ratio in the mobile phase, (D) strength of the buffer, and (E) injection volume] on respective responses [(R1) Rt of MPN, (R2) peak area of MPN, (R3) number of theoretical plates, (R4) tailing factor 5%, and (R5) tailing factor 10%].

[Click here to view]

The Pareto charts revealed that factors A, B, and C had t-values exceeding their Bonferroni limits, confirming their significance. Conversely, factors D and E were deemed non-significant due to their t-values falling below the Bonferroni limits.

Subsequently, numerical optimization was performed to determine the ideal values for the non-significant factors (buffer strength and injection volume) to achieve the desired responses. Among the potential solutions offered by the software, the solution with the highest desirability (desirability = 1) was chosen. As per the numerical optimization, the ideal injection volume was 10 μl, and the ideal buffer strength was 10 mM.

The factors A, B, and C were found significant and subjected to optimization using the Box-Behnken design.

Optimization of factors using Box-Behnken design

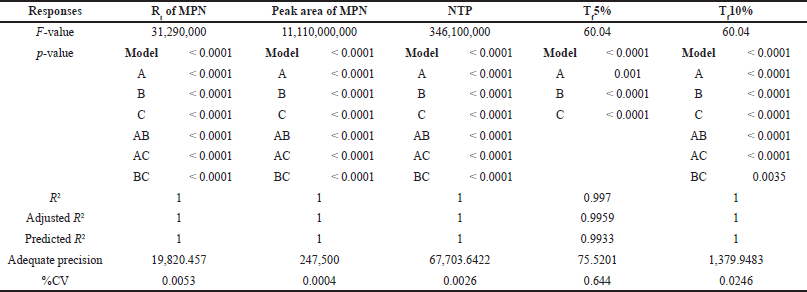
A 2-level Box-Behnken design with their center points was performed for three independent factors [A: pH of the buffer, B: flow rate, and C: acetonitrile ratio in the mobile phase]. The software recommended 12 experimental runs were performed, and the results are tabulated in Table 6. The effect of individual independent factors on responses was analyzed using a quadratic regression model through analysis of variance (ANOVA). The results of the ANOVA test for all the independent factors from the quadratic model represent the main effects and interaction effects of factors on responses, and the results are tabulated in Table 7. The impact of individual factors on responses was briefly discussed in a further section.
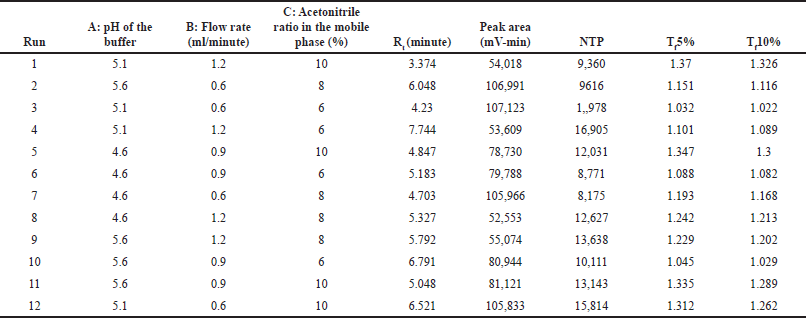
Table 6. Experimental runs and their results based on Box-Behnken design.

[Click here to view]
Table 7. Results of the ANOVA test for all the independent factors from the quadratic model.

[Click here to view]

Analysis of the effect of individual independent factors on the Rt

The quadratic model and ANOVA results led to the following coded equation for Rt (Y1):

Y 1 = + 5 . 4 7 + 0 . 4 5 2 4 A + 0 . 0 9 1 9 B 0 . 5 1 9 8 C 0 . 2 2 0 0 AB 0 . 3 5 1 8 AC 1 . 6 7 BC . ( 1 )

This equation, alongside Figure 3(R1), suggests that the buffer pH and flow rate positively affect Rt, while the acetonitrile ratio in the mobile phase negatively impacts it. At pH 4.6, MPN becomes more polar, and as the pH increases, its lipophilicity rises, enhancing retention. Increasing the acetonitrile ratio in the mobile phase reduces Rt due to decreased polarity. The flow rate also influences Rt, with a higher flow rate resulting in a slight increase in retention due to the interaction with acetonitrile concentration.
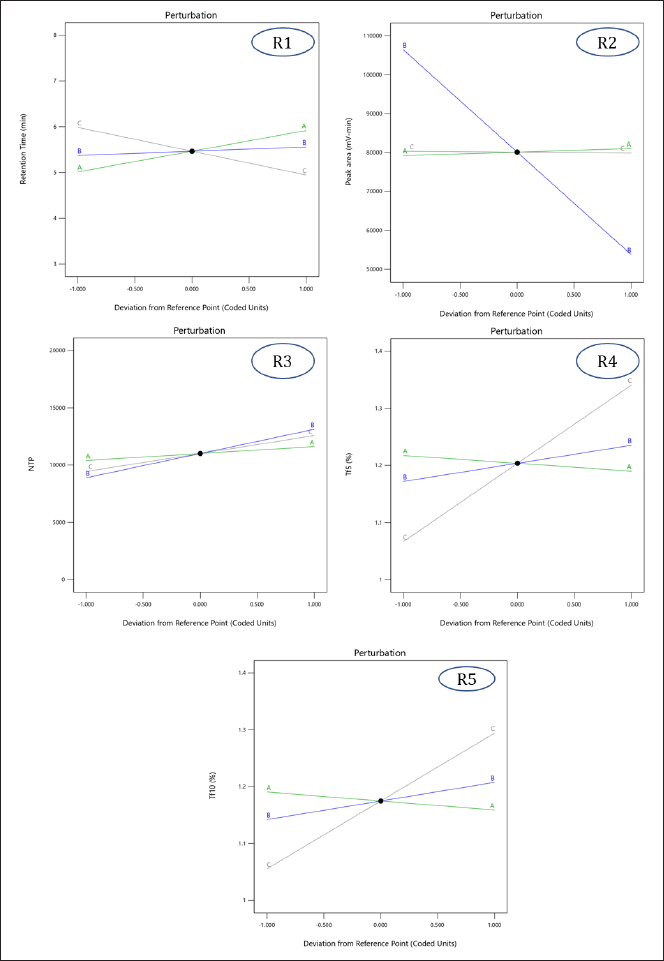
Figure 3. Perturbation plots demonstrating the effect of independent variables [(A) pH of the buffer, (B) flow rate, and (C) acetonitrile ratio in the mobile phase] on individual responses [(R1) Rt of MPN, (R2) peak area for MPN, (R3) number of theoretical plates, (R4) tailing factor 5%, and (R5) tailing factor 10%].

[Click here to view]

Analysis of the effect of individual independent factors on the peak area

The coded equation for peak area (Y2) is:

Y 2 = + 8 0 1 4 5 . 8 3 + 8 8 6 . 6 2 A 2 6 3 3 2 . 3 8 B 2 2 0 . 2 5 C + 3 7 4 . 0 0 AB + 3 0 8 . 7 5 AC + 4 2 4 . 7 5 BC ( 2 )

Here, buffer pH positively impacts peak area, while flow rate and acetonitrile ratio negatively affect it. Increasing the buffer pH enhances the degree of ionization, slightly increasing the peak area. Higher flow rates reduce peak area due to decreased analyte Rt, while an increased acetonitrile ratio causes a negligible decrease in peak area due to changes in ionization (Fig. 3(R2)).

Analysis of the effect of individual independent factors on the number of theoretical plates

The coded equation for the number of theoretical plates (Y3) is:

Y 3 = + 1 1 0 1 4 . 0 8 + 6 1 3 . 0 0 A + 2 1 1 8 . 3 8 B + 1 5 7 2 . 8 8 C 1 0 7 . 5 0 AB 5 7 . 0 0 AC 5 3 4 5 . 2 5 BC ( 3 )

Flow rate, buffer pH, and acetonitrile ratio all positively affect theoretical plates. Contrary to theoretical understanding, increasing the flow rate resulted in a higher number of theoretical plates due to interactions with other factors. Increased pH enhances ionization, improving elution efficiency, and an increased acetonitrile ratio improves elution efficiency, increasing the number of theoretical plates (Fig. 3(R3)).

Analysis of the effect of individual independent factors on the tailing factor 5% and the tailing factor 10%

Equations 4 and 5 are coded equations for the tailing factor 5% (Y4) and the tailing factor 10% (Y5), respectively.

Y 4 = + 1 . 2 0 0 . 0 1 3 8 c + 0 . 0 3 1 7 B + 0 . 1 3 7 3 C ( 4 )

Y 5 = + 1 . 1 7 0 . 0 1 5 9 A + 0 . 0 3 2 7 B + 0 . 1 1 9 4 C + 0 . 0 1 0 3 AB + 0 . 0 1 0 5 AC 0 . 0 0 0 7 BC .

Flow rate and acetonitrile ratio increase the tailing factor, as higher flow rates reduce analyte-column interaction time, causing band broadening and peak tailing. Increased acetonitrile reduces polarity, resulting in broader peaks and higher tailing factors. Buffer pH, conversely, improves peak symmetry by altering the ionization state, and reducing tailing (Fig. 3 (R4) and (R5)).

Development and verification of method operable design space

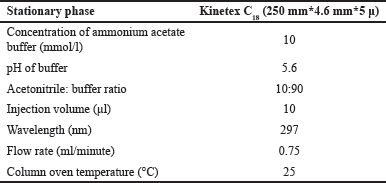
After using a regression model to analyze the factors, numerical optimization was used to develop the design space. The software generates 47 prospective solutions, of which the optimized solution was chosen (Fig. 4.) based on the highest desirability value (0.807). Conclusively, DOE helped in a complete understanding of the method, allowing for improved method development and subsequent method transfer with minimum systematic and inherent random variability. Based on the analysis of the Box-Behnken design, the optimal parameters were determined and tabulated in Table 8 for the developed method. Three sets of experimental runs were conducted as per optimized analytical conditions. The observed experimental results matched the model-predicted results, as tabulated in Table 9. The table provides a side-by-side view of predicted outcomes against actual observations, assessed at a two-sided 95% confidence interval (CI) and a 99% population interval.
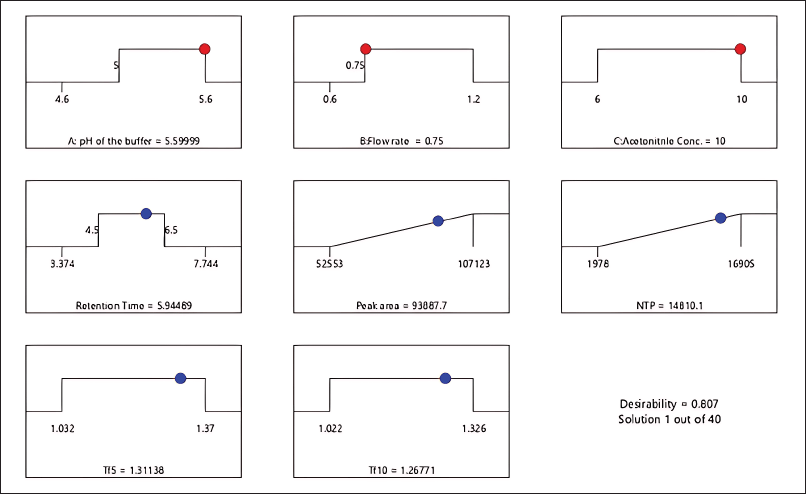
Figure 4. Numerical optimization indicates an optimized solution with the highest desirability value.

[Click here to view]
Table 8. Optimal chromatographic conditions.

[Click here to view]
Table 9. Predicted and actual point prediction at two-sided 95% CI.

[Click here to view]

Validation of the optimized HPLC method

The optimized HPLC method was validated by performing a rigorous set of experiments recommended by ICH Q2(R1) guidelines that assessed the method’s performance under various conditions. The results of all the validation parameters are listed in Table 10.
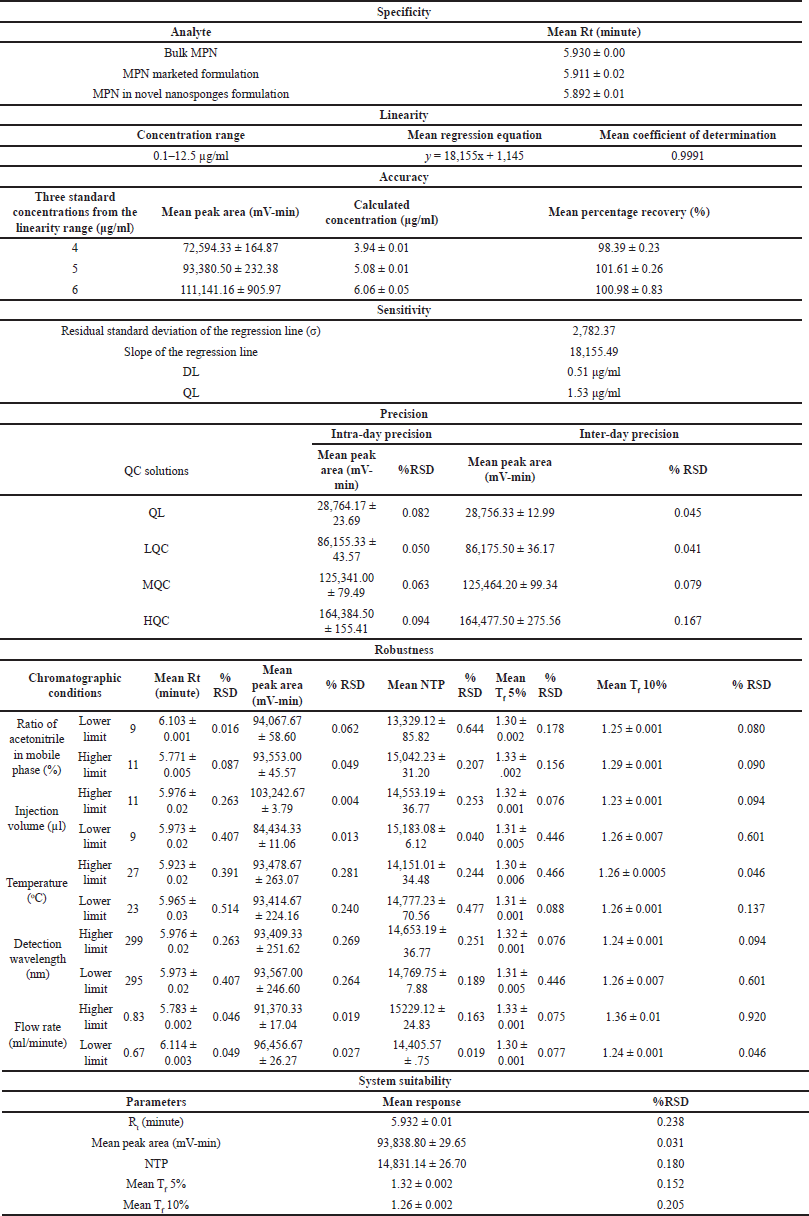
Table 10. Results of all the validation parameters.

[Click here to view]

Specificity

The method represented a distinctive peak for MPN at a Rt of 5.93 minutes, as illustrated in Figure 5. No interferences were observed at the Rt of the MPN from the blank and placebo of the novel formulation. The developed method eluted the MPN from the marketed formulation and the novel nanosponges formulation at a Rt of 5.91 and 5.89 minutes, respectively. Hence, the optimized method was demonstrated to be highly specific in determining MPN.
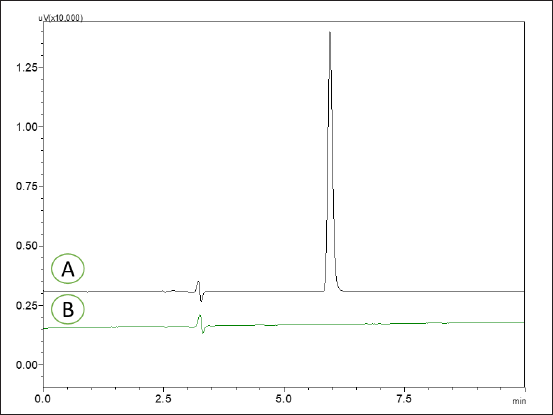
Figure 5. HPLC chromatograms of MPN reference standard 5 μg/ml (A) and HPLC chromatograms of blank (B).

[Click here to view]

Linearity

MPN were analyzed in quintuplicate for a concentration range of 0.1 to 12.5 μg/ml. Individual linear plots were constructed for each trial, and the mean of all trials was calculated. According to the plotted linear regression graph, the linear regression equation for the mean value was y = 18155x+1145. The coefficient of determination (R2) was found to be 0.9991. Out of five linear regression plots, no two consecutive R2 values were less than 0.999. Therefore, the optimized method was significantly linear in the MPN concentration range and subjected to further experimentation.

Accuracy and precision

Three different MPN concentrations were injected in sextuplicate, and the mean percentage recovery of the concentrations 4, 5, and 6 μg/ml were 98.39%, 101.61%, and 100.98%, respectively. The accuracy results showed that the mean recovery percentage of analysis of MPN was well within the range of 85%–115%. Thus, the optimized method demonstrates suitability for the accurate quantification of MPN.

Four QC concentrations of MPN were injected in duplicate, and in the intraday analysis, the mean peak areas of the concentrations of 1.53, 4.59, 8.75, and 6.67 μg/ml were 28,764.17, 86,155.33, 125,341.00, and 164,384.5 mV-min, respectively. In the inter-day analysis, the same four QC concentrations of MPN were injected in duplicate; the mean peak areas of the concentrations of 1.53, 4.59, 8.75, and 6.67 μg/ml were 28,756.33, 86,175.5, 125,464.2, and 164,477.5 mV-min, respectively. The precision results showed that the % RSD of the peak area for all the concentrations in intraday and interday analyses was less than 2%. Thus, the optimized method demonstrates suitability for the precise quantification of MPN. The optimized technique has exhibited a high degree of suitability for the precise quantification of MPN.

The analytical performance of our developed method was statistically compared with the previously reported method by Mendez et al. [11] The precision comparison using F-test revealed that our method demonstrates significantly better precision, with %RSD values ranging from 0.041% to 0.167% compared to their reported values of 0.78% (intra-day) and 0.85% (inter-day). The calculated F-values were lower than the critical F-value at a 95% confidence level, confirming the superior precision of our method. In terms of accuracy, our method showed recovery values ranging from 98.39% to 101.61%, which was comparable to their reported range of 99.11%–100.10%. The Student’s t-test performed on the recovery data showed no significant difference between the two methods at a 95% confidence level, indicating that both methods are equally accurate. These statistical comparisons demonstrate that our method maintains equivalent accuracy while offering improved precision compared to the previously reported method.  

Sensitivity

The DL was calculated based on the residual standard deviation of the regression line and its slope. The DL and QL were determined and found to be 0.51 and 1.53 μg/ml, respectively.

Robustness

An MPN concentration of 5 μg/ml was injected in triplicate, and the impact of small variations in the operating conditions, like the acetonitrile ratio in the mobile phase, column oven temperature, wavelength, flow rate, and injection volume, was analyzed. For all the varied conditions, the mean %RSD of peak area, Rt, number of theoretical plates, tailing factor 5%, and tailing factor 10% were less than 2. The optimized methodology has been demonstrated to have a high degree of robustness in obtaining precise and accurate quantifications of MPN in response to variations in operating conditions.

System suitability

An MPN concentration of 5 μg/ml was injected in sextuplicate and analyzed for mean Rt, peak area, number of theoretical plates, tailing factor 5%, and tailing factor 10%. The consistent results from sextuplicate trials ensure the suitability of the analytical system for the intended application of quantification of MPN in dosage forms.

Benchtop stability studies of MPN solution

The benchtop stability study was carried out to assess the stability of MPN in solution under ambient temperature conditions, and the results are depicted in Table 11. The analysis of lower and higher QC MPN concentrations (4.59 and 8.75 μg/ml, respectively) over time revealed that the stability of MPN was significantly affected by storage duration at ambient temperature. Results showed that the Rt of MPN remained the same (5.942 minutes), and the MPN concentration of 4.59 and 8.75 μg/ml decreased to 91.31% and 92.51% of the initial concentration after 24 hours, respectively, and to 77.38% and 78.91% after 48 hours, respectively. This implies that the MPN undergoes hydrolysis, which gradually converts the active form of the drug into the inactive form. The similarity index for the 48 and 24 hours stability was determined and tabulated in Table 11.
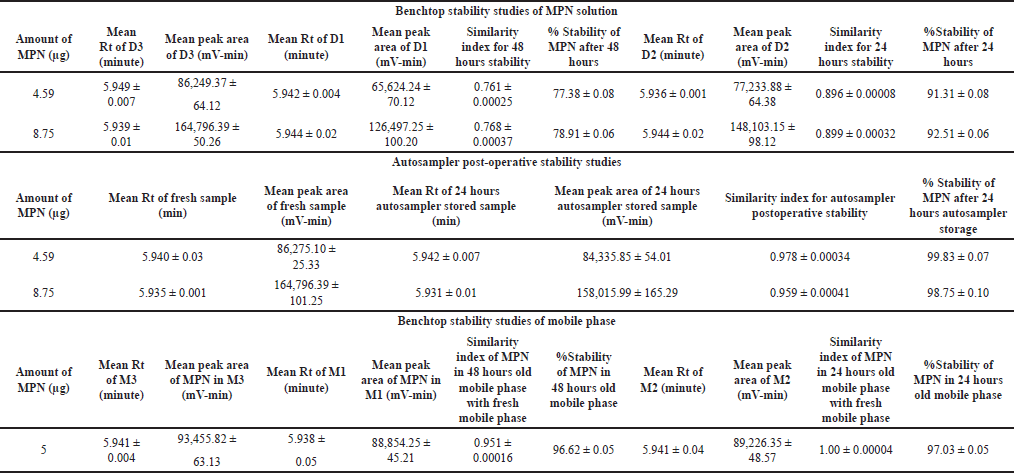
Table 11. Results of stability studies.

[Click here to view]

Autosampler post-operative stability studies of MPN solution

Autosampler post-operative stability studies were conducted to assess the stability of MPN in solution form, stored in an autosampler at 4°C for 24 hours. Over time, the analysis of lower and higher QC MPN concentrations (4.59 and 8.75 μg/ml) revealed that storage duration at 4oC negligibly influenced the MPN stability. The results indicated that the Rt of MPN remained the same (5.937 minutes), and the MPN concentration of 4.59 and 8.75 μg/ml was stable and remained at 99.83% and 98.75% of the initial concentration after 24 hours at 4°C, respectively, as represented in Table 11. This implies that the rate of hydrolysis was significantly reduced at lower temperatures (refrigerated conditions).

Benchtop stability studies of the mobile phase

Benchtop stability studies were performed on the mobile phase to evaluate its stability at ambient temperature over a specific period and its ability to elute MPN. The analysis of the MPN concentration of 5 μg/ml over time showed that the stability of the mobile phase had a minimal impact on the concentration of MPN, and the Rt of MPN remained the same (5.940 minutes). The results indicated that the MPN concentration decreased to 96.62% and 97.03% of the initial concentration after 48 and 24 hours, respectively, as represented in Table 11. This demonstrates that the mobile phase was stable for 48 hours and can elute MPN effectively even after 48 hours.

Acid—induced degradation studies

Real-Time Conditions: MPN was subjected to 0.1 N and 1 N HCl at ambient temperature for 24 hours to evaluate its stability under acidic conditions. The analysis showed significant degradation, with MPN concentrations reducing by 82.23% and 89.16%, respectively. Degradation peaks were observed near the solvent front (1–3 minutes), indicating acid-catalyzed protonation of the MPN molecule. This reaction heightened molecular reactivity, leading to hydrolysis and the formation of inactive degradation products.

Accelerated Conditions: MPN solutions were exposed to 0.1 N and 1 N HCl at 60°C to simulate accelerated degradation. Substantial degradation was noted, with the primary peak showing splitting and additional peaks near the solvent front. The degradation process was attributed to combined acid-catalyzed hydrolysis and thermal effects, emphasizing the need for controlled storage conditions to maintain drug stability.

Alkali—induced degradation studies

Real-Time Conditions: Stability studies involved exposing MPN to 0.1 N and 1 N NaOH at ambient temperature. After 24 hours, degradation levels reached 75.09% and 91.19%, respectively. The basic environment deprotonated the MPN molecule, promoting beta-lactam ring cleavage and subsequent degradation.

Accelerated Conditions: MPN solutions in 0.1 N and 1 N NaOH were heated to 60°C. Significant degradation was observed, characterized by the splitting of the main peak and additional degradation peaks near the solvent front. The combined effects of base-catalyzed hydrolysis and thermal degradation led to the formation of less active products, indicating the susceptibility of MPN to alkaline and high-temperature conditions.

Oxidative degradation studies

Real-Time Conditions: MPN stability was evaluated by exposing solutions to 3% hydrogen peroxide (H2O2) at ambient temperature for 24 hours. Results indicated 30% degradation, likely due to oxidation of the sulfur atom in the thiazolidine ring or cleavage of the beta-lactam ring.

Accelerated Conditions: To simulate oxidative stress, MPN solutions were treated with 3% H2O2 and heated to 60°C. Accelerated degradation was evident, with peak splitting and new degradation peaks near the solvent front. Free radical formation and elevated temperatures exacerbated bond cleavage and molecular destabilization.

Photolytic degradation studies

Photolytic stability was assessed by exposing MPN to UV light and direct sunlight for 24 hours. The concentration of MPN decreased by 20%, driven by photodegradation. UV-induced bond cleavage formed unstable degradation products, with peaks observed near the solvent front. This study underscores MPN’s sensitivity to light exposure and highlights the importance of protecting the drug from UV and sunlight.

Application of the developed analytical method for quantification of MPN in marketed products and novel nanoformulations

The validated HPLC method was successfully applied for the quantification of MPN in a marketed powder for injection formulation (Merosure 125 mg, Alkem Laboratories, India) and a novel β-CD nanosponges formulation, demonstrating its feasibility for real-world applications.

Quantification of MPN in the marketed formulation

A stock solution of 10 μg/ml of MPN prepared from the marketed product was analyzed using the developed method. The results showed consistent Rt and peak area, with a recovery rate of 99%, highlighting the method’s high accuracy and precision.
Quantification of MPN in β-CD-nanosponges

A stock solution of 10 μg/ml of MPN prepared from the marketed product was analyzed using the developed method. The results showed consistent Rt and peak area, with a recovery rate of 99%, highlighting the method’s high accuracy and precision.


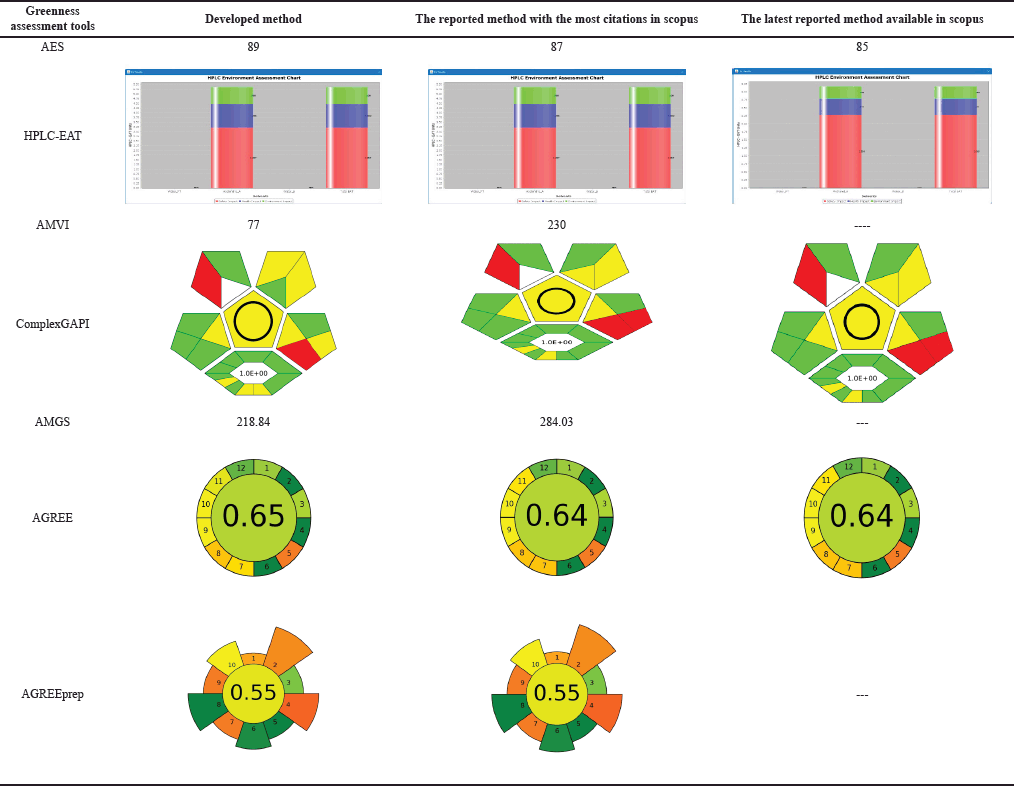
THE GREENNESS OF THE ANALYTICAL METHOD

The principles of GAC focus on reducing or eliminating the detrimental impact of chemicals employed in analytical methodologies, conserving energy, and curtailing waste generation, all while maintaining the method’s analytical efficacy. The green credential of an analytical method is ascertained using multifaceted GAC benchmarks. A myriad of green assessment tools, such as the AES, the HPLC-Eco-Scale Analytical Tool (HPLC-EAT), the Analytical Method Volume Intensity (AMVI), the Complementary Green Analytical Procedure Index (ComplexGAPI), the Analytical Method Greenness Score (AMGS), and both AGREE calculators [AGREE and analytical greenness preparation (AGREEprep)], have been harnessed to holistically evaluate every facet of the analytical procedure [53, 54]. Our proposed method was compared against the “reported method with most citations in Scopus” [11] and the “latest reported method available in Scopus” [14]. These comparisons aimed to showcase the green credentials of the developed method in relation to other existing analytical approaches [43].

Assessment of greenness using the AES tool

The AES is a semi-quantitative environmental scorecard that evaluates analytical processes using a penalty point system. It considers the quantity and hazards of chemicals, energy consumption, occupational hazards, and waste generation [42, 5557].

The AES rating is derived by deducting the cumulative penalty points from the ideal score (100). Thus, a score closer to 100 indicates a greener method [58, 59].

AES = 100 − Total penalty points

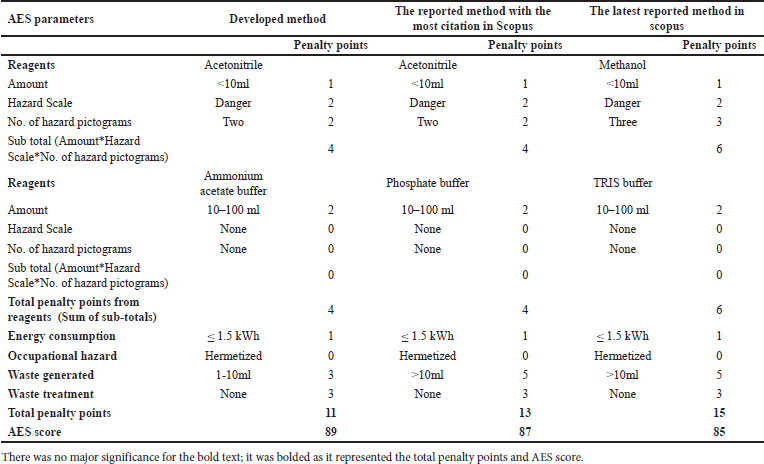
For the developed method, AES calculations show a score of 89, making it the most eco-friendly compared to the reported methods, which scored 87 and 85, respectively. Acetonitrile was used in all methods, with each earning penalty points based on its quantity, hazard rating, and hazard pictograms. The developed method used less than 10 ml of acetonitrile, resulting in 4 penalty points, while the other methods had higher penalty points due to methanol’s increased hazard pictograms. Waste generation was also lower for the developed method, contributing fewer penalty points (three compared to five for others). All methods used HPLC with similar energy consumption, earning one penalty point for energy. Waste treatment was not applied to any method, resulting in an additional three penalty points.

Table 12 shows the AES scores for all three methods, highlighting the developed method’s superior environmental performance.

Table 12. AES scoring.

[Click here to view]

Assessment of greenness using the HPLC-EAT tool

The HPLC-EAT evaluates the greenness of chromatographic methods by considering the safety, health, and environmental impacts of solvents. The tool is freely available at: http://pubs.rsc.org/en/Content/ArticleLanding/2011/GC/c0gc00667j. The score is calculated based on solvent mass and its safety, health, and environmental characteristics using the equation:

HPLC− EAT = S1m1 + H1m1 + E1m1 + S2m2 + H2m2 + E2m2 + …… Snmn + Hnmn + Enmn

Here, S, H, and E represent safety, health, and environmental concerns, and m is the solvent mass used. A lower score indicates a greener method [53, 60].

We used this tool to assess the developed and existing methods, resulting in scores of 1.59, 4.81, and 6.32, respectively, showing that our method is more environmentally friendly (Table 14).

Assessment of greenness using the AMVI tool

The AMVI tool is a standardized metric designed for pharmaceutical laboratories to evaluate the environmental impact of analytical methods. It calculates total solvent consumption, including solvents used for sample preparation and during HPLC analysis, and accounts for the number of samples and chromatographic peaks analyzed [53, 61]. The formula is:

Total solvent consumption

Number of chromatographic peaks of interest

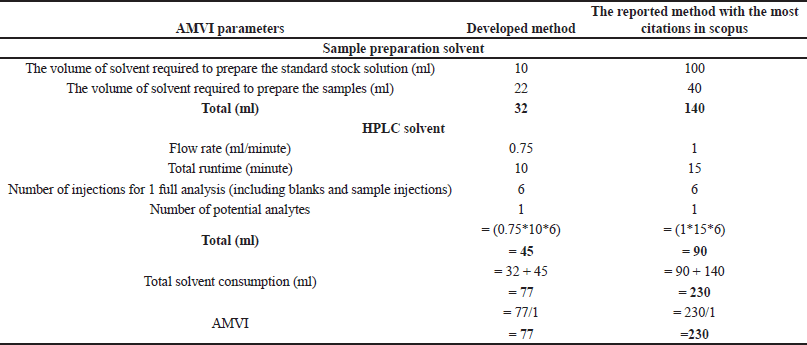
A lower AMVI value indicates a greener method. We calculated AMVI scores for the developed method and the most cited method, yielding scores of 77 and 230, respectively. Our method proved more environmentally friendly (Table 13).

Table 13. AMVI scoring.

[Click here to view]
Table 14. Results of various greenness assessments.

[Click here to view]

Assessment of greenness using the ComplexGAPI tool

The Green Analytical Procedure Index (GAPI) provides a semi-quantitative environmental assessment using a pentagonal design divided into 15 segments representing various aspects of the analytical process (Table 14). GAPI uses a color-coding system—green, yellow, and red—to denote low, medium, and high environmental impacts. Despite its detailed analysis, GAPI’s complexity and limitations in evaluating all elements accurately prompted the development of ComplexGAPI, which includes a hexagonal component to emphasize pre-analysis activities. ComplexGAPI provides a free software application mostwiedzy.pl/complexgapi that simplifies the evaluation by directly inputting method parameters and generating a pictogram. It incorporates GAPI parameters alongside additional considerations, such as yield/selectivity, reagents and solvents, instrumentation, and the E-factor. The pictogram includes a central circle, indicating a quantitative technique, while the E-factor measures waste generation [62, 63].

The ComplexGAPI analysis showed that the developed method had an eco-friendly profile with 9 green, 13 yellow, and 2 red segments. This was compared to the most cited method (9 green, 12 yellow, and 3 red) and the latest method (7 green, 14 yellow, and 3 red). The developed method used less than 10 ml of solvent per sample, produced less waste (1–10 ml), and had a lower occupational risk due to hermetic sealing, contributing to its higher green rating. All methods achieved yields above 89%, with processing at room temperature in less than 1 hour, earning green scores for these parameters. The developed method met 5–6 green economy rules, indicating its superior environmental compatibility for HPLC quantification of MPN [64].

Assessment of greenness using the AMGS tool

The AMGS is a quantitative tool for assessing the environmental footprint of analytical methods. It considers factors such as instrument energy consumption, solvents’ cumulative energy demand, and waste generation based on Environment, Health, and Safety parameters. The AMGS program, which is freely available online, provides a comprehensive evaluation of a method’s environmental sustainability. The program is accessible at no cost at www.acsgcipr.org/amgs [53, 64].

For our developed method, the AMGS revealed a greener profile, with a score of 218.84, compared to the most-cited method’s score of 284.03. A lower score indicates a greener method, confirming our developed method’s superior environmental sustainability.

Assessment of greenness using the analytical greenness calculator (AGREE) tool

The AGREE tool is a comprehensive, user-friendly tool that aligns with the 12 principles of GAC, offering a more flexible and interpretable analysis compared to previous tools. It assigns a score from 0 to 1 to each criterion, indicating the degree of adherence to GAC principles. The final score, represented on a clock face, suggests the method’s overall eco-friendliness, with a score above 0.6 indicating a green method [41]. This open-source program is available at https://mostwiedzy.pl/AGREE [53].

The AGREE analysis of the developed and compared methods revealed that all three methods are considered green. The developed method scored 0.65, slightly higher than the compared methods (0.64 and 0.62). All methods utilized LC-based analysis, with solvent volumes and waste generation similar across the methods. While the results were not significantly different, our method had a slight advantage in terms of greenness.

Assessment of greenness using the AGREEprep sample calculator tool

The AGREEprep tool, an extension of the AGREE framework, focuses on evaluating the environmental impact of sample preparation steps in analytical methods. Based on the green sample preparation principles, AGREEprep assigns a subscore (0–1) for each principle, offering a detailed environmental assessment. A pictogram is generated to reflect the method’s overall environmental footprint and hazardous content. The tool is freely accessible via https://mostwiedzy.pl/AGREEprep [53].

We used AGREEprep to assess the environmental footprint of the developed method and the most-cited method in Scopus. Both methods utilize online sample preparation, and over 75% of the solvents used are sustainable or renewable water-based buffers. Parameters like waste production, sample size, and throughput were similar across both methods. The energy consumption for both methods was less than 1.5 kWh. Acetonitrile, a hazardous solvent used in both methods, was also considered. AGREEprep gave a score of 0.57 for the developed method and 0.55 for the most-cited method, indicating a slightly greener profile for the developed method.

Indeed, the utilization of seven distinct greenness assessment tools allowed us to comprehensively evaluate various facets of our developed HPLC method. By employing this array of tools, each with its own unique focus, we ensured a thorough exploration of diverse environmental parameters. The unanimous outcomes from these tools consistently favoring our method over the existing ones affirm its overall superiority in terms of ecological friendliness from multiple angles.


CLINICAL AND PATIENT IMPLICATIONS

The developed HPLC-UV method for MPN quantification ensures accurate dosing, crucial for preventing treatment failure and antimicrobial resistance. Its high precision and robustness make it a reliable tool for QC in pharmaceutical formulations, supporting effective patient therapy. The stability and degradation studies provide essential data for optimizing storage conditions, preserving drug efficacy, and ensuring safe clinical use. Additionally, the method’s application to nanosponges highlights its potential to enhance drug stability and controlled release, which could improve patient compliance and therapeutic outcomes. By integrating GAC principles, this method reduces solvent consumption and environmental impact, aligning with sustainable pharmaceutical practices. Overall, this study offers a clinically relevant, reliable, and eco-friendly analytical approach to support effective antibiotic therapy.


CONCLUSION

In a world increasingly aligned with the United Nations’ SDGs, the fusion of pharmaceutical research and environmental stewardship gains paramount importance. This study vividly embodies this synergy by introducing an HPLC method for quantifying MPN. Conceived through the meticulous Quality-by-Design approach, our method validates the aspects of precision, reliability, and adaptability, as evidenced by its proficient application across both the marketed formulation and the novel nanosponge formulation. Validations as per the stringent ICH Q2 (R1) guidelines cement the method’s credibility, while its demonstrable resilience in exhaustive stability and degradation evaluations ensures its broader applicability in diverse pharmaceutical scenarios. However, our study’s commitment to environmental prudence shines brightly beyond these technical accolades. The embrace of GAC and a rigorous assessment of the method’s ecological footprint heralds a new era in pharmaceutical research, where technical excellence seamlessly combined with environmental consciousness. Further, our method’s marked reduction in environmental impact, when juxtaposed against prevailing methodologies in literature, establishes its pioneering status in analytical competence and sustainability. As the pharmaceutical landscape evolves, our research signals a pressing call to the broader scientific community: the path ahead should exemplify technical prowess and be deeply rooted in ecological responsibility. Our work, thus, stands as a beacon, pointing towards a future where pharmaceutical innovation and planetary well-being walk hand in hand.


AUTHOR CONTRIBUTIONS

All authors made substantial contributions to conception and design, acquisition of data, or analysis and interpretation of data; took part in drafting the article or revising it critically for important intellectual content; agreed to submit to the current journal; gave final approval of the version to be published; and agree to be accountable for all aspects of the work. All the authors are eligible to be an author as per the International Committee of Medical Journal Editors (ICMJE) requirements/guidelines.


FINANCIAL SUPPORT

This study was supported by the Indian Council of Medical Research (ICMR), New Delhi, Ref. No 35/13/2020-/Nano/BMS to Dr Usha Y Nayak and Ref. No. AMR/Fellowship/25/2022-ECD-11 to Ms Ashwini T to work in this area.


CONFLICTS OF INTEREST

The authors report no financial or any other conflicts of interest in this work.


ETHICAL APPROVALS

This study does not involve experiments on animals or human subjects.


DATA AVAILABILITY

All data generated and analyzed are included in this research article.


PUBLISHER’S NOTE

This journal remains neutral with regard to jurisdictional claims in published institutional affiliation.


USE OF ARTIFICIAL INTELLIGENCE (AI)-ASSISTED TECHNOLOGY

The authors declares that they have not used artificial intelligence (AI)-tools for writing and editing of the manuscript, and no images were manipulated using AI.


REFERENCES

1. Flockton TR, Schnorbus L, Araujo A, Adams J, Hammel M, Perez LJ. Inhibition of Pseudomonas aeruginosa biofilm formation with surface modified polymeric nanoparticles. Pathogens. 2019;8(2):55. 

2. Sommer R, Wagner S, Rox K, Varrot A, Hauck D, Wamhoff EC, et al. Glycomimetic, orally bioavailable LecB inhibitors block biofilm formation of Pseudomonas aeruginosa. J Am Chem Soc. 2018;140:2537–45.

3. Iyer M. Antimicrobial resistance is rising in India, says ICMR report. Times of India. 2021.

4. Centers for Disease Control and Preventions. Antibiotic resistance threats report. 2019 [cited 2023 May 17]. Available from: https://www.cdc.gov/drugresistance/biggest-threats.html

5. World Health Organization. Antimicrobial resistance. Geneva Switzerland: World Health Organization; 2021 Nov 17 [cited 2023 May 17]. Available from: https://www.who.int/news-room/fact-sheets/detail/antimicrobial-resistance

6. Memar MY, Yekani M, Ghanbari H, Shahi S, Sharifi S, Maleki Dizaj S. Biocompatibility, cytotoxicity and antibacterial effects of meropenem-loaded mesoporous silica nanoparticles against carbapenem-resistant Enterobacteriaceae. Artif Cells Nanomed Biotechnol. 2020;48:1354–61.

7. Mhango EKG, Kalhapure RS, Jadhav M, Sonawane SJ, Mocktar C, Vepuri S, et al. Preparation and optimization of meropenem-loaded solid lipid nanoparticles: in vitro evaluation and molecular modeling. AAPS PharmSciTech. 2017;18:2011–25.

8. Drulis-Kawa Z, Gubernator J, Dorotkiewicz-Jach A, Doroszkiewicz W, Kozubek A. A comparison of the in vitro antimicrobial activity of liposomes containing meropenem and gentamicin. Cell Mol Biol Lett. 2006;11(3):360–75. 

9. Singh H, Du J, Singh P, Yi TH. Extracellular synthesis of silver nanoparticles by Pseudomonas sp. THG-LS1.4 and their antimicrobial application. J Pharm Anal. 2018;8:258–64.

10. Sreekanth Reddy O, Subha MCS, Jithendra T, Madhavi C, Chowdoji Rao K. Curcumin encapsulated dual cross linked sodium alginate/montmorillonite polymeric composite beads for controlled drug delivery. J Pharm Anal. 2021;11:191–9.

11. Mendez ASL, Steppe M, Schapoval EES. Validation of HPLC and UV spectrophotometric methods for the determination of meropenem in pharmaceutical dosage form. J Pharm Biomed Anal. 2003;33:947–54.

12. Milla P, Ferrari F, Muntoni E, Sartori M, Ronco C, Arpicco S. Validation of a simple and economic HPLC-UV method for the simultaneous determination of vancomycin, meropenem, piperacillin and tazobactam in plasma samples. J Chromatogr B. 2020;1148:122151.

13. Paal M, Zoller M, Schuster C, Vogeser M, Schütze G. Simultaneous quantification of cefepime, meropenem, ciprofloxacin, moxifloxacin, linezolid and piperacillin in human serum using an isotope-dilution HPLC–MS/MS method. J Pharm Biomed Anal. 2018;152:102–10.

14. Roth T, Fiedler S, Mihai S, Parsch H. Determination of meropenem levels in human serum by high-performance liquid chromatography with ultraviolet detection. Biomed Chromatogr. 2017;31:e3880.

15. Rakete S, Schuster C, Paal M, Vogeser M. An isotope-dilution LC-MS/MS method for the simultaneous quantification of meropenem and its open-ring metabolite in serum. J Pharm Biomed Anal. 2021;197:113944.

16. Krná? D, Reiffová K, Rolinski B. A new HPLC-MS/MS analytical method for quantification of tazobactam, piperacillin, and meropenem in human plasma. J Sep Sci. 2021;44:2744–53.

17. Gorantla S, Saha RN, Singhvi G. Design of experiment-driven stability-indicating RP-HPLC method for the determination of tofacitinib in nanoparticles and skin matrix. Futur J Pharm Sci. 2021;7:180.

18. Madhu S, Komala M, Pandian P. Formulation development and characterization of withaferin-a loaded polymeric nanoparticles for alzheimer’s disease. Bionanoscience. 2021;11:559–66.

19. Musmade KP, Trilok M, Dengale SJ , Bhat K, Reddy MS, Musmade PB, et al. Development and validation of liquid chromatographic method for estimation of naringin in nanoformulation. J Pharm (Cairo). 2014;2014:1–8.

20. Khanum R, Mallikarjun C, Qureshi MJ, Mohandas K, Rathbone MJ. Development and validation of a RP-HPLC method for the detection of meropenem as a pure compound, in a pharmaceutical dosage form and post thermal induced degradation. Int J Pharm Pharm Sci. 6(4):149–52. 

21. Rao Narala S, Saraswathi K. RP-HPLC and visible spectrophotometric methods for the estimation of meropenem in pure and pharmaceutical formulations. Int J ChemTech Res. 2011;3:605–9.

22. Kazanova AM, Stepanova ES, Makarenkova LM, Chistyakov VV, Zyryanov SK, Senchenko SP. Development and validation of a quantitative determination method for meropenem in blood plasma for therapeutic drug monitoring. Pharm Chem J. 2020;54:414–8.

23. Rao LV, Ramu G, Kumar MS, Rambabu C. Reverse phase HPLC and visible spectrophotometric methods for the determination of meropenem in pure and pharmaceutical dosage form. Int J PharmTech Res. 2012;4:957–62.

24. Farin D, Kitzes-Cohen R, Piva G, Gozlan I. High performance liquid chromatography method for the determination of meropenem in human plasma. Chromatographia. 1999 Mar;49:253–5.

25. Lee HS, Shim HO, Yu SR. High-performance liquid chromatographic determination of meropenem in rat plasma using column-switching. Chromatographia. 1996 Apr;42:405–8.

26. Cao H, Yin L, Cao H, Guo H, Ren W, Li Y, et al. A sensitive and selective HPLC–MS3 method for therapeutic drug monitoring of meropenem and its validation by comparison with HPLC–MS2 methods. J Sep Sci. 2022;45:1683–92.

27. Martens-Lobenhoffer J, Bode-Böger SM. Quantification of meropenem in human plasma by HILIC—tandem mass spectrometry. J Chromatogr B Analyt Technol Biomed Life Sci. 2017;1046:13–7.

28. Yang P, Zhang X, Zhou C, Zhai S, Wang C, Yang L. Determination of free and total meropenem levels in human plasma and its application for the consistency evaluation of generic drugs. Rapid Commun Mass Spectrom. 2023 Mar 15;37(5):e9460.

29. Negi V, Chander V, Singh R, Sharma B, Singh P, Upadhaya K. Method development and validation of meropenem in pharmaceutical dosage form by RP-HPLC. Indian J Chem Technol. 2017;24:441–6.

30. Chang P, Dai LL, Zhang DJ, Wang BJ, Guo RC. Determination of meropenem in human plasma by HPLC: validation and its application to pharmacokinetic study. Lat Am J Pharm. 2014 Jan 1;33:870–4.

31. Ikeda K, Ikawa K, Morikawa N, Miki M, Nishimura S, Kobayashi M. High-performance liquid chromatography with ultraviolet detection for real-time therapeutic drug monitoring of meropenem in plasma. J Chromatogr B Analyt Technol Biomed Life Sci. 2007;856:371–5.

32. Elkhaïli H, Niedergang S, Pompei D, Linger L, Leveque D, Jehl F. High-performance liquid chromatographic assay for meropenem in serum. J Chromatogr B Biomed Appl. 1996 Nov 8;686(1):19–26. 

33. Al-Meshal MA, Ramadan MA, Lotfi KM, Shibl AM. Determination of meropenem in plasma by high-performance liquid chromatography and a microbiological method. J Clin Pharm Ther. 1995 Jun;20(3):159–63. 

34. Gopalan D, Patil PH, Jagadish PC, Kini SG, Alex AT, Udupa N, et al. QbD-driven HPLC method for the quantification of rivastigmine in rat plasma and brain for pharmacokinetics study. J Appl Pharm Sci. 2022;12:56–67.

35. Bhaskaran NA, Kumar L, Reddy MS, Pai GK. An analytical ‘quality by design’ approach in RP-HPLC method development and validation for reliable and rapid estimation of irinotecan in an injectable formulation. Acta Pharma. 2021;71:57–79.

36. Kumar L, Sreenivasa Reddy M, Managuli RS, Pai KG. Full factorial design for optimization, development and validation of HPLC method to determine valsartan in nanoparticles. Saudi Pharm J. 2015;23:549–55.

37. Patil PH, Desai M, Rao RR, Mutalik S, Shenoy GG, Rao M, et al. Assessment of pH-shift drug interactions of palbociclib by in vitro micro-dissolution in bio relevant media: an analytical QbD-driven RP-HPLC method optimization. J Appl Pharm Sci. 2022;12:78–87.

38. Hemdan A, Magdy R, Farouk M, Fares NV. Central composite design as an analytical optimization tool for the development of eco-friendly HPLC-PDA methods for two antihypertensive mixtures containing the angiotensin receptor blocker Valsartan: greenness assessment by four evaluation tools. Microchem J. 2022 Dec 1;183:108105. 

39. P?otka-Wasylka J. A new tool for the evaluation of the analytical procedure: green analytical procedure index. Talanta. 2018;181:204–9.

40. Ferreira SS, Brito TA, Santana AP, Guimarães TG, Lamarca RS, Ferreira KC, et al. Greenness of procedures using NADES in the preparation of vegetal samples: comparison of five green metrics. Talanta Open. 2022 Dec 1;6:100131. 

41. Amin KFM. Evaluation of greenness and whiteness assessment of chemometric assisted techniques for simultaneous determination of canagliflozin, sitagliptin, metformin, pioglitazone, and glimepiride in a quinary mixture. Sustain Chem Pharm. 2023 Oct 1;35:101181. 

42. Abdallah NA, Fathy ME, Tolba MM, El-Brashy AM, Ibrahim FA. A quality-by-design eco-friendly UV-HPLC method for the determination of four drugs used to treat symptoms of common cold and COVID-19. Sci Rep. 2023 Jan 28;13(1):1616. 

43. Shaaban H. The ecological impact of liquid chromatographic methods reported for bioanalysis of COVID-19 drug, hydroxychloroquine: insights on greenness assessment. Microchem J. 2023 Jan 1;184:108145.

44. International Council for Harmonisation. Committee for Human Medicinal Products ICH guideline Q8 (R2) on pharmaceutical development. 2017 [cited 2023 May 18]. Available from: www.ema.europa.eu/contact

45. International Council for Harmonisation. ICH topic Q 2 (R1) validation of analytical procedures: text and methodology. 1995 [cited 2023 May 18]. 

46. International Council for Harmonisation. ICH guideline Q14 on analytical procedure development. 2022 [cited 2023 May 18]. Available from: www.ema.europa.eu/contact

47. Miriam Marques S, Shirodkar RK, Kumar L. Analytical ‘Quality-by-Design’ paradigm in development of a RP-HPLC method for the estimation of cilnidipine in nanoformulations: forced degradation studies and mathematical modelling of in-vitro release studies. Microchem J. 2023 Oct 1;193:109124.

48. Mullick P, Mutalik SP, Hegde AR, Pandey A, Jagadish PC, Kini SG, et al. Simultaneous estimation of Apremilast and betamethasone Dipropionate in microsponge-based topical formulation using a stability indicating RP-HPLC method: a quality-by-design approach. J Chromatogr Sci. 2021;59:928–40.

49. International Conference on harmonisation of technical requirements for registration of pharmaceuticals for human use ich harmonised tripartite guideline validation of analytical procedures: text and methodology Q2(R1). November 2005.

50. Padya BS, Hegde AR, Mutalik SP, Biswas S, Mutalik S. Analytical and bioanalytical HPLC method for simultaneous estimation of 5-fluorouracil and sonidegib. Bioanalysis. 2022;14:29–45.

51. Mutalik SP, Mullick P, Pandey A, Kulkarni SS, Mutalik S. Box–Behnken design aided optimization and validation of developed reverse phase HPLC analytical method for simultaneous quantification of dolutegravir sodium and lamivudine co-loaded in nano-liposomes. J Sep Sci. 2021;44:2917–31.

52. Asela I, Donoso-Gonzalez O, Yutronic N, Sierpe R. β-cyclodextrin-based nanosponges functionalized with drugs and gold nanoparticles. Pharmaceutics. 2021 Apr 8;13(4):513. 

53. Imam MS, Abdelrahman MM. How environmentally friendly is the analytical process? A paradigm overview of ten greenness assessment metric approaches for analytical methods. Trends Environ Anal Chem. 2023 Jun 1;38:e00202. 

54. Naguib IA, Abdelaleem EA, Emam AA, Ali NW, Abdallah FF. Development and validation of HPTLC and green HPLC methods for determination of furosemide, spironolactone and canrenone, in pure forms, tablets and spiked human plasma. Biomed Chromatogr. 2018 Oct;32(10):e4304. 

55. Kannaiah KP, Sugumaran A. Eco-friendly multivariant green analytical technique for the estimation of ketoconazole by UV spectroscopy in bulk and cream formulation. Quim Nova. 2022;45:23–30.

56. Gamal M, Naguib IA, Panda DS, Abdallah FF. Comparative study of four greenness assessment tools for selection of greenest analytical method for assay of hyoscine: N-butyl bromide. Anal Methods. 2021;13:369–80.

57. Ga?uszka A, Migaszewski ZM, Konieczka P, Namie?nik J. Analytical Eco-Scale for assessing the greenness of analytical procedures. TrAC - Trends Anal Chem. 2012;37:61–72.

58. Elbordiny HS, Elonsy SM, Daabees HG, Belal TS. Development and comprehensive greenness assessment for MEKC and HPTLC methods for simultaneous estimation of sertaconazole with two co-formulated preservatives in pharmaceutical dosage forms. Sustain Chem Pharm. 2022 Apr 1;25:100580. 

59. Moema D, Makwakwa TA, Gebreyohannes BE, Dube S, Nindi MM. Hollow fiber liquid phase microextraction of fluoroquinolones in chicken livers followed by high pressure liquid chromatography: greenness assessment using National Environmental Methods Index Label (NEMI), green analytical procedure index (GAPI), Analytical GREEnness metric (AGREE), and Eco Scale. J Food Compos Anal. 2023 Apr 1;117:105131. 

60. Gaber Y, Törnvall U, Kumar MA, Amin MA, Hatti-Kaul R. HPLC-EAT (Environmental Assessment Tool): a tool for profiling safety, health and environmental impacts of liquid chromatography methods. Green Chem. 2011;13:2021–5.

61. Hartman R, Helmy R, Al-Sayah M, Welch CJ. Analytical Method Volume Intensity (AMVI): a green chemistry metric for HPLC methodology in the pharmaceutical industry. Green Chem. 2011;13:934–9.

62. El-Maraghy CM. Implementation of green chemistry to develop HPLC/UV and HPTLC methods for the quality control of Fluconazole in presence of two official impurities in drug substance and pharmaceutical formulations. Sustain Chem Pharm. 2023 Jun 1;33:101124. 

63. P?otka-Wasylka J, Wojnowski W. Complementary green analytical procedure index (ComplexGAPI) and software. Green Chem. 2021;23:8657–65.

64. Chanduluru HK, Sugumaran A. Estimation of pitavastatin and ezetimibe using UPLC by a combined approach of analytical quality by design with green analytical technique. Acta Chromatogr. 2022;34:361–72.

Reference

1. Flockton TR, Schnorbus L, Araujo A, Adams J, Hammel M, Perez LJ. Inhibition of Pseudomonas aeruginosa biofilm formation with surface modified polymeric nanoparticles. Pathogens. 2019;8(2):55. https://doi.org/10.3390/pathogens8020055

2. Sommer R, Wagner S, Rox K, Varrot A, Hauck D, Wamhoff EC, et al. Glycomimetic, orally bioavailable LecB inhibitors block biofilm formation of Pseudomonas aeruginosa. J Am Chem Soc. 2018;140:2537-45. https://doi.org/10.1021/jacs.7b11133

3. Iyer M. Antimicrobial resistance is rising in India, says ICMR report. Times of India. 2021.

4. Centers for Disease Control and Preventions. Antibiotic resistance threats report. 2019 [cited 2023 May 17]. Available from: https://www.cdc.gov/drugresistance/biggest-threats.html

5. World Health Organization. Antimicrobial resistance. Geneva Switzerland: World Health Organization; 2021 Nov 17 [cited 2023 May 17]. Available from: https://www.who.int/news-room/fact-sheets/detail/antimicrobial-resistance

6. Memar MY, Yekani M, Ghanbari H, Shahi S, Sharifi S, Maleki Dizaj S. Biocompatibility, cytotoxicity and antibacterial effects of meropenem-loaded mesoporous silica nanoparticles against carbapenem-resistant Enterobacteriaceae. Artif Cells Nanomed Biotechnol. 2020;48:1354-61. https://doi.org/10.1080/21691401.2020.1850466

7. Mhango EKG, Kalhapure RS, Jadhav M, Sonawane SJ, Mocktar C, Vepuri S, et al. Preparation and optimization of meropenem-loaded solid lipid nanoparticles: in vitro evaluation and molecular modeling. AAPS PharmSciTech. 2017;18:2011-25. https://doi.org/10.1208/s12249-016-0675-z

8. Drulis-Kawa Z, Gubernator J, Dorotkiewicz-Jach A, Doroszkiewicz W, Kozubek A. A comparison of the in vitro antimicrobial activity of liposomes containing meropenem and gentamicin. Cell Mol Biol Lett. 2006;11(3):360-75. https://doi.org/10.2478/s11658-006-0030-6

9. Singh H, Du J, Singh P, Yi TH. Extracellular synthesis of silver nanoparticles by Pseudomonas sp. THG-LS1.4 and their antimicrobial application. J Pharm Anal. 2018;8:258-64. https://doi.org/10.1016/j.jpha.2018.04.004

10. Sreekanth Reddy O, Subha MCS, Jithendra T, Madhavi C, Chowdoji Rao K. Curcumin encapsulated dual cross linked sodium alginate/montmorillonite polymeric composite beads for controlled drug delivery. J Pharm Anal. 2021;11:191-9. https://doi.org/10.1016/j.jpha.2020.07.002

11. Mendez ASL, Steppe M, Schapoval EES. Validation of HPLC and UV spectrophotometric methods for the determination of meropenem in pharmaceutical dosage form. J Pharm Biomed Anal. 2003;33:947-54. https://doi.org/10.1016/S0731-7085(03)00366-2

12. Milla P, Ferrari F, Muntoni E, Sartori M, Ronco C, Arpicco S. Validation of a simple and economic HPLC-UV method for the simultaneous determination of vancomycin, meropenem, piperacillin and tazobactam in plasma samples. J Chromatogr B. 2020;1148:122151. https://doi.org/10.1016/j.jchromb.2020.122151

13. Paal M, Zoller M, Schuster C, Vogeser M, Schütze G. Simultaneous quantification of cefepime, meropenem, ciprofloxacin, moxifloxacin, linezolid and piperacillin in human serum using an isotope-dilution HPLC-MS/MS method. J Pharm Biomed Anal. 2018;152:102-10. https://doi.org/10.1016/j.jpba.2018.01.031

14. Roth T, Fiedler S, Mihai S, Parsch H. Determination of meropenem levels in human serum by high-performance liquid chromatography with ultraviolet detection. Biomed Chromatogr. 2017;31:e3880. https://doi.org/10.1002/bmc.3880

15. Rakete S, Schuster C, Paal M, Vogeser M. An isotope-dilution LC-MS/MS method for the simultaneous quantification of meropenem and its open-ring metabolite in serum. J Pharm Biomed Anal. 2021;197:113944. https://doi.org/10.1016/j.jpba.2021.113944

16. Krná? D, Reiffová K, Rolinski B. A new HPLC-MS/MS analytical method for quantification of tazobactam, piperacillin, and meropenem in human plasma. J Sep Sci. 2021;44:2744-53. https://doi.org/10.1002/jssc.202100067

17. Gorantla S, Saha RN, Singhvi G. Design of experiment-driven stability-indicating RP-HPLC method for the determination of tofacitinib in nanoparticles and skin matrix. Futur J Pharm Sci. 2021;7:180. https://doi.org/10.1186/s43094-021-00325-0

18. Madhu S, Komala M, Pandian P. Formulation development and characterization of withaferin-a loaded polymeric nanoparticles for alzheimer’s disease. Bionanoscience. 2021;11:559-66. https://doi.org/10.1007/s12668-020-00819-w

19. Musmade KP, Trilok M, Dengale SJ , Bhat K, Reddy MS, Musmade PB, et al. Development and validation of liquid chromatographic method for estimation of naringin in nanoformulation. J Pharm (Cairo). 2014;2014:1-8. https://doi.org/10.1155/2014/864901

20. Khanum R, Mallikarjun C, Qureshi MJ, Mohandas K, Rathbone MJ. Development and validation of a RP-HPLC method for the detection of meropenem as a pure compound, in a pharmaceutical dosage form and post thermal induced degradation. Int J Pharm Pharm Sci. 6(4):149-52. Available from: http://whatsthedose.com/spl/0409-3505.html

21. Rao Narala S, Saraswathi K. RP-HPLC and visible spectrophotometric methods for the estimation of meropenem in pure and pharmaceutical formulations. Int J ChemTech Res. 2011;3:605-9.

22. Kazanova AM, Stepanova ES, Makarenkova LM, Chistyakov VV, Zyryanov SK, Senchenko SP. Development and validation of a quantitative determination method for meropenem in blood plasma for therapeutic drug monitoring. Pharm Chem J. 2020;54:414-8. https://doi.org/10.1007/s11094-020-02212-z

23. Rao LV, Ramu G, Kumar MS, Rambabu C. Reverse phase HPLC and visible spectrophotometric methods for the determination of meropenem in pure and pharmaceutical dosage form. Int J PharmTech Res. 2012;4:957-62.

24. Farin D, Kitzes-Cohen R, Piva G, Gozlan I. High performance liquid chromatography method for the determination of meropenem in human plasma. Chromatographia. 1999 Mar;49:253-5. https://doi.org/10.1007/BF02467552

25. Lee HS, Shim HO, Yu SR. High-performance liquid chromatographic determination of meropenem in rat plasma using column-switching. Chromatographia. 1996 Apr;42:405-8. https://doi.org/10.1007/BF02272131

26. Cao H, Yin L, Cao H, Guo H, Ren W, Li Y, et al. A sensitive and selective HPLC-MS3 method for therapeutic drug monitoring of meropenem and its validation by comparison with HPLC-MS2 methods. J Sep Sci. 2022;45:1683-92. https://doi.org/10.1002/jssc.202200064

27. Martens-Lobenhoffer J, Bode-Böger SM. Quantification of meropenem in human plasma by HILIC-tandem mass spectrometry. J Chromatogr B Analyt Technol Biomed Life Sci. 2017;1046:13-7. https://doi.org/10.1016/j.jchromb.2017.01.016

28. Yang P, Zhang X, Zhou C, Zhai S, Wang C, Yang L. Determination of free and total meropenem levels in human plasma and its application for the consistency evaluation of generic drugs. Rapid Commun Mass Spectrom. 2023 Mar 15;37(5):e9460. https://doi.org/10.1002/rcm.9460

29. Negi V, Chander V, Singh R, Sharma B, Singh P, Upadhaya K. Method development and validation of meropenem in pharmaceutical dosage form by RP-HPLC. Indian J Chem Technol. 2017;24:441-6.

30. Chang P, Dai LL, Zhang DJ, Wang BJ, Guo RC. Determination of meropenem in human plasma by HPLC: validation and its application to pharmacokinetic study. Lat Am J Pharm. 2014 Jan 1;33:870-4.

31. Ikeda K, Ikawa K, Morikawa N, Miki M, Nishimura S, Kobayashi M. High-performance liquid chromatography with ultraviolet detection for real-time therapeutic drug monitoring of meropenem in plasma. J Chromatogr B Analyt Technol Biomed Life Sci. 2007;856:371-5. https://doi.org/10.1016/j.jchromb.2007.05.043

32. Elkhaïli H, Niedergang S, Pompei D, Linger L, Leveque D, Jehl F. High-performance liquid chromatographic assay for meropenem in serum. J Chromatogr B Biomed Appl. 1996 Nov 8;686(1):19-26. https://doi.org/10.1016/S0378-4347(96)00205-8

33. Al-Meshal MA, Ramadan MA, Lotfi KM, Shibl AM. Determination of meropenem in plasma by high-performance liquid chromatography and a microbiological method. J Clin Pharm Ther. 1995 Jun;20(3):159-63. https://doi.org/10.1111/j.1365-2710.1995.tb00642.x

34. Gopalan D, Patil PH, Jagadish PC, Kini SG, Alex AT, Udupa N, et al. QbD-driven HPLC method for the quantification of rivastigmine in rat plasma and brain for pharmacokinetics study. J Appl Pharm Sci. 2022;12:56-67. https://doi.org/10.7324/JAPS.2022.120606

35. Bhaskaran NA, Kumar L, Reddy MS, Pai GK. An analytical ‘quality by design’ approach in RP-HPLC method development and validation for reliable and rapid estimation of irinotecan in an injectable formulation. Acta Pharma. 2021;71:57-79. https://doi.org/10.2478/acph-2021-0008

36. Kumar L, Sreenivasa Reddy M, Managuli RS, Pai KG. Full factorial design for optimization, development and validation of HPLC method to determine valsartan in nanoparticles. Saudi Pharm J. 2015;23:549-55. https://doi.org/10.1016/j.jsps.2015.02.001

37. Patil PH, Desai M, Rao RR, Mutalik S, Shenoy GG, Rao M, et al. Assessment of pH-shift drug interactions of palbociclib by in vitro micro-dissolution in bio relevant media: an analytical QbD-driven RP-HPLC method optimization. J Appl Pharm Sci. 2022;12:78-87.

38. Hemdan A, Magdy R, Farouk M, Fares NV. Central composite design as an analytical optimization tool for the development of eco-friendly HPLC-PDA methods for two antihypertensive mixtures containing the angiotensin receptor blocker Valsartan: greenness assessment by four evaluation tools. Microchem J. 2022 Dec 1;183:108105. https://doi.org/10.1016/j.microc.2022.108105

39. P?otka-Wasylka J. A new tool for the evaluation of the analytical procedure: green analytical procedure index. Talanta. 2018;181:204-9. https://doi.org/10.1016/j.talanta.2018.01.013

40. Ferreira SS, Brito TA, Santana AP, Guimarães TG, Lamarca RS, Ferreira KC, et al. Greenness of procedures using NADES in the preparation of vegetal samples: comparison of five green metrics. Talanta Open. 2022 Dec 1;6:100131. https://doi.org/10.1016/j.talo.2022.100131

41. Amin KFM. Evaluation of greenness and whiteness assessment of chemometric assisted techniques for simultaneous determination of canagliflozin, sitagliptin, metformin, pioglitazone, and glimepiride in a quinary mixture. Sustain Chem Pharm. 2023 Oct 1;35:101181. https://doi.org/10.1016/j.scp.2023.101181

42. Abdallah NA, Fathy ME, Tolba MM, El-Brashy AM, Ibrahim FA. A quality-by-design eco-friendly UV-HPLC method for the determination of four drugs used to treat symptoms of common cold and COVID-19. Sci Rep. 2023 Jan 28;13(1):1616. https://doi.org/10.1038/s41598-023-28737-3

43. Shaaban H. The ecological impact of liquid chromatographic methods reported for bioanalysis of COVID-19 drug, hydroxychloroquine: insights on greenness assessment. Microchem J. 2023 Jan 1;184:108145. https://doi.org/10.1016/j.microc.2022.108145

44. International Council for Harmonisation. Committee for Human Medicinal Products ICH guideline Q8 (R2) on pharmaceutical development. 2017 [cited 2023 May 18]. Available from: www.ema.europa.eu/contact

45. International Council for Harmonisation. ICH topic Q 2 (R1) validation of analytical procedures: text and methodology. 1995 [cited 2023 May 18]. Available from: http://www.emea.eu.int

46. International Council for Harmonisation. ICH guideline Q14 on analytical procedure development. 2022 [cited 2023 May 18]. Available from: www.ema.europa.eu/contact

47. Miriam Marques S, Shirodkar RK, Kumar L. Analytical ‘Quality-by-Design’ paradigm in development of a RP-HPLC method for the estimation of cilnidipine in nanoformulations: forced degradation studies and mathematical modelling of in-vitro release studies. Microchem J. 2023 Oct 1;193:109124. https://doi.org/10.1016/j.microc.2023.109124

48. Mullick P, Mutalik SP, Hegde AR, Pandey A, Jagadish PC, Kini SG, et al. Simultaneous estimation of Apremilast and betamethasone Dipropionate in microsponge-based topical formulation using a stability indicating RP-HPLC method: a quality-by-design approach. J Chromatogr Sci. 2021;59:928-40. https://doi.org/10.1093/chromsci/bmab016

49. International Conference on harmonisation of technical requirements for registration of pharmaceuticals for human use ich harmonised tripartite guideline validation of analytical procedures: text and methodology Q2(R1). November 2005.

50. Padya BS, Hegde AR, Mutalik SP, Biswas S, Mutalik S. Analytical and bioanalytical HPLC method for simultaneous estimation of 5-fluorouracil and sonidegib. Bioanalysis. 2022;14:29-45. https://doi.org/10.4155/bio-2021-0212

51. Mutalik SP, Mullick P, Pandey A, Kulkarni SS, Mutalik S. Box-Behnken design aided optimization and validation of developed reverse phase HPLC analytical method for simultaneous quantification of dolutegravir sodium and lamivudine co-loaded in nano-liposomes. J Sep Sci. 2021;44:2917-31. https://doi.org/10.1002/jssc.202100152

52. Asela I, Donoso-Gonzalez O, Yutronic N, Sierpe R. β-cyclodextrin-based nanosponges functionalized with drugs and gold nanoparticles. Pharmaceutics. 2021 Apr 8;13(4):513. https://doi.org/10.3390/pharmaceutics13040513

53. Imam MS, Abdelrahman MM. How environmentally friendly is the analytical process? A paradigm overview of ten greenness assessment metric approaches for analytical methods. Trends Environ Anal Chem. 2023 Jun 1;38:e00202. https://doi.org/10.1016/j.teac.2023.e00202

54. Naguib IA, Abdelaleem EA, Emam AA, Ali NW, Abdallah FF. Development and validation of HPTLC and green HPLC methods for determination of furosemide, spironolactone and canrenone, in pure forms, tablets and spiked human plasma. Biomed Chromatogr. 2018 Oct;32(10):e4304. https://doi.org/10.1002/bmc.4304

55. Kannaiah KP, Sugumaran A. Eco-friendly multivariant green analytical technique for the estimation of ketoconazole by UV spectroscopy in bulk and cream formulation. Quim Nova. 2022;45:23-30. https://doi.org/10.21577/0100-4042.20170798

56. Gamal M, Naguib IA, Panda DS, Abdallah FF. Comparative study of four greenness assessment tools for selection of greenest analytical method for assay of hyoscine: N-butyl bromide. Anal Methods. 2021;13:369-80. https://doi.org/10.1039/D0AY02169E

57. Ga?uszka A, Migaszewski ZM, Konieczka P, Namie?nik J. Analytical Eco-Scale for assessing the greenness of analytical procedures. TrAC - Trends Anal Chem. 2012;37:61-72. https://doi.org/10.1016/j.trac.2012.03.013

58. Elbordiny HS, Elonsy SM, Daabees HG, Belal TS. Development and comprehensive greenness assessment for MEKC and HPTLC methods for simultaneous estimation of sertaconazole with two co-formulated preservatives in pharmaceutical dosage forms. Sustain Chem Pharm. 2022 Apr 1;25:100580. https://doi.org/10.1016/j.scp.2021.100580

59. Moema D, Makwakwa TA, Gebreyohannes BE, Dube S, Nindi MM. Hollow fiber liquid phase microextraction of fluoroquinolones in chicken livers followed by high pressure liquid chromatography: greenness assessment using National Environmental Methods Index Label (NEMI), green analytical procedure index (GAPI), Analytical GREEnness metric (AGREE), and Eco Scale. J Food Compos Anal. 2023 Apr 1;117:105131. https://doi.org/10.1016/j.jfca.2023.105131

60. Gaber Y, Törnvall U, Kumar MA, Amin MA, Hatti-Kaul R. HPLC-EAT (Environmental Assessment Tool): a tool for profiling safety, health and environmental impacts of liquid chromatography methods. Green Chem. 2011;13:2021-5. https://doi.org/10.1039/c0gc00667j

61. Hartman R, Helmy R, Al-Sayah M, Welch CJ. Analytical Method Volume Intensity (AMVI): a green chemistry metric for HPLC methodology in the pharmaceutical industry. Green Chem. 2011;13:934-9. https://doi.org/10.1039/c0gc00524j

62. El-Maraghy CM. Implementation of green chemistry to develop HPLC/UV and HPTLC methods for the quality control of Fluconazole in presence of two official impurities in drug substance and pharmaceutical formulations. Sustain Chem Pharm. 2023 Jun 1;33:101124. https://doi.org/10.1016/j.scp.2023.101124

63. P?otka-Wasylka J, Wojnowski W. Complementary green analytical procedure index (ComplexGAPI) and software. Green Chem. 2021;23:8657-65. https://doi.org/10.1039/D1GC02318G

64. Chanduluru HK, Sugumaran A. Estimation of pitavastatin and ezetimibe using UPLC by a combined approach of analytical quality by design with green analytical technique. Acta Chromatogr. 2022;34:361-72. https://doi.org/10.1556/1326.2021.00949

Article Metrics
143 Views 85 Downloads 228 Total

Year

Month

Related Search

By author names