
INTRODUCTION
Chlordiazepoxide hydrochloride is a benzodiazepine class molecule. Moreover, it is well known for its safety and effectiveness in the treatment of various psychological conditions, such as anxiety in patients, pre-surgical anxiety, and alcohol withdrawal symptoms [1-15]. As an old and effective medicine, it has become important to carry out regular control of medicinal quality and safety in terms of pharmacopeia quality systems. For instance, the manufacture of active pharmaceutical ingredients for medicine may lead to the appearance of potential genotoxic impurities (PGIs), which may be hazardous for public health even at trace levels [16-19]. N-nitroso compounds are known for their genotoxicity [20-32]. Nitrosamines are known mutagens and can form DNA adducts during metabolism. These adducts have the potential to cause miscoding errors in DNA replication, which can result in mutations and increase the risk of cancer [33]. Notably, our research identified a reaction pathway in which chlordiazepoxide and sodium nitrite under acidic conditions (pH 0.5–5) react and yield N-nitrosochlordiazepoxide [34-37]. Based on this reaction pathway, we successfully synthesized N-nitrosochlordiazepoxide from its active pharmaceutical ingredient (API) and characterized this PGI using different analytical tools, including UV spectroscopy, which provides invaluable insights into electronic transitions; infrared spectroscopy (IR), which elucidates the molecular structure; and high-pressure liquid chromatography (HPLC), which facilitates meticulous separation. Mass spectrometry augments our understanding by revealing molecular weight and structural information, while nuclear magnetic resonance (NMR) spectroscopy delves into the intricate molecular framework. We validated the Liquid chromatography-tandem mass spectrometry (LC-MS/MS) method following the guidelines outlined in The International Conference of Harmonization (ICH) Q2 (R1). For the assurance of drug safety, the International Council of Harmonization, the European Medicines Agency, and the United States Food and Drug Administration, on regulating PGIs in drug substances have released relevant guidelines [38-40]. Our study offers insights into the formation of N-nitrosochlordiazepoxide from chlordiazepoxide, leading to a pharmaceutical analysis by providing precise quantification of PGI. Through this ground-breaking research, we aim to accelerate progress in the analytical sciences, thereby contributing to improving pharmaceutical product quality and safety.
The evaluation of N-nitrosochlordiazepoxide (Structure as shown in Fig. 2) was conducted following regulatory guidelines issued by the US FDA CDER on August 2023, Recommended Acceptable Intake (AI) [41] as shown in Figure 1.
A method for analyzing chlordiazepoxide’s nitrosation products using “high-pressure liquid chromatography” was reported [42]. However, to date, there are no LC-MS/MS methods tailored for specifically detecting and quantifying N-nitrosochlordiazepoxide in chlordiazepoxide hydrochloride.
EXPERIMENTAL STUDY
Materials and methods
Chemicals and reagents
Sodium nitrite (99% AR grade, Loba Chemie), Glacial acetic acid (99.8% AR grade, Rankem), sodium sulfate anhydrous (purity 99.0% LR grade, Thomas Bakers), dichloromethane (99.7% AR grade, standard reagents), potassium bromide (≥ 99.5% IR Spectroscopic grade), in-house HPLC grade water, HPLC grade methanol (≥99%, standard reagents), LCMS grade methanol (purity 99.9%, J.T.Baker), LCMS grade water (Honeywell), formic acid (98.3%, TCI), chlordiazepoxide samples (purity by HPLC >99.5%, free sample from Flowchem Pharma Pvt Ltd.), Whatman filter paper (grade 41), and membrane filters (0.45 µm, Axiva) were used.
Instrumentation
An analytical weighing balance (Shimadzu, model AP225WD, 0.1 mg accuracy), UV?visible spectrometer (Shimadzu, model UV1800), HPLC (Shimadzu, Model LC2030C Prominence-I), IR spectra were recorded using Fourier transform infrared spectroscopy (FTIR) (Shimadzu, model IRAffinity-1S), and LCMS chromatograms were recorded using a Shimadzu 8045 LC-MS/MS system with a high-pressure switch valve model FCV20AH2 equipped with Lab solution software. An NMR spectrometer (Bruker, model Ascend Evo 400MHz) was used to record the 1H and 13C-NMR spectra. The quantitative structure-activity relationship (QSAR) software tool used for toxicity estimation is TOXTREE. Class A standard volumetric flasks and pipettes were used for standard and sample preparations.
QSAR of N-Nitrosochlordiazepoxide
The QSAR of N-nitrosochlordiazepoxide in Toxtree software, according to the Cramer rule, classified it as Class III, indicating high toxicity and a structural alert for S. typhimurium mutagenicity and genotoxic carcinogenicity due to its functional groups linked to increased toxicity. N-nitrosochlordiazepoxide contains a nitroso group and alpha carbons (C2 and C3) likely devoid of hydrogen atoms, involved in forming the diazepine ring and potentially binding with other functional groups.
Method
N-Nitrosochlordiazepoxide synthesis
N-nitrosochlordiazepoxide was synthesized from chlordiazepoxide based on the observation of N-nitroso impurities manifested upon exposing the drug substance to an acidic environment in the presence of sodium nitrite. The synthesis procedure, as depicted in Figure 3, commenced by dissolving 3.0 g (0.01 moles) of chlordiazepoxide hydrochloride in 20 ml of HPLC-grade water at room temperature (RT). Subsequently, 0.90 grams (0.013 moles) of sodium nitrite was slowly added at RT. The pH of the reaction mass was adjusted to 4.5–4.6 using 20 ml of acetic acid at RT, resulting in the formation of a light yellowish precipitate at pH 3.2. Following this, 300 ml of HPLC-grade water was added to the reaction mixture, which was then stirred for an additional 2 hours at RT. The solid product was filtered using Whatman filter paper, and the resulting filtrate was dissolved in 20 ml of dichloromethane with the aid of ultrasonication. The solution was then transferred to a separating funnel and basified with 5% sodium bicarbonate. The dichloromethane layer was separated, filtered, and dried using sodium sulphate to remove water. Subsequently, the residue was further concentrated via vacuum distillation, resulting in a final weight of 0.987 grams.
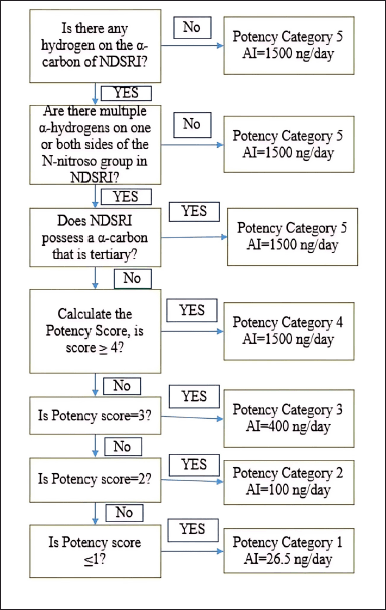 | Figure 1. Flowchart of the USFDA CDER Guidelines of August 2023 for predicting the carcinogenic potency category of an NDSRI and identifying an associated recommended acceptable intake (AI). [Click here to view] |
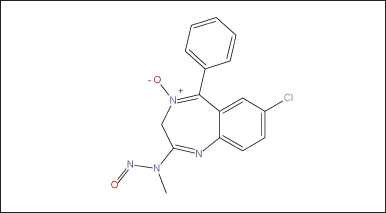 | Figure 2. Structure of N-nitrosochlordiazepoxide. [Click here to view] |
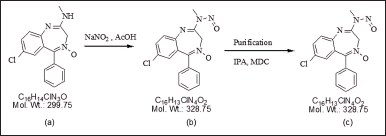 | Figure 3. Synthetic route of N-nitrosochlordiazepoxide, (a) chlordiazepoxide, (b) N-nitrosochlordiazepoxide crude, and (c) pure N-nitroso chlordiazepoxide. [Click here to view] |
Recrystallization
The residue was dissolved in 2 ml of dichloromethane and filtered. The resulting filtrate was then concentrated to 50% of its volume, after which 5 ml of isopropyl alcohol was added. The solid crystals were allowed to settle at 10°C–15°C for 30 minutes before filtration. Subsequently, the wet material underwent vacuum drying at 60–°C65°C for 8 hours. The resulting dry material weighed 0.940 g, yielding 29%.
spectroscopy
The spectroscopic analyses provided crucial structural insights into the synthesized compounds. UV-visible spectroscopy showed distinct absorption patterns, with chlordiazepoxide hydrochloride peaking at 263.30 nm and N-nitrosochlordiazepoxide at 291.0 nm. FTIR analysis revealed characteristic stretching vibrations for the N = O nitroso group (1501 cm−¹) and N–O bonds (945 cm−¹). Mass spectrometry confirmed molecular identities, with mass?charge ratios of 300.05 [M+H]+ for chlordiazepoxide and 329.05 [M+H]+ for N-nitrosochlordiazepoxide. NMR spectroscopy elucidated proton and carbon distributions, showcasing 1H NMR signals ranging from δ 7.034 to 7.628 (m, 8H, Aromatic-H), δ 5.358-(m, 2H, CH2), and δ 3.340–3.419 (s, 3H, CH3), and 13C NMR chemical shifts at various positions.
Physical characterization
We characterized the synthesized material, which appeared as a light-yellowish solid with a melting point between 155°C and 158°C.
Chromatography purity by HPLC
The purity of the synthesized compound was evaluated by HPLC under the following chromatographic conditions. Detection carried at 254 nm wavelength. A C18 HPLC column measuring 30 cm in length, 0.4 cm inner diameter, and particle size of 5 μm was used, and the oven temperature of the column was adjusted to 40°C. The mobile phase was prepared by adding 600 ml of methanol and 400 ml of water in a 1,000ml flask, the flow rate was adjusted to 1 ml/minute, and the mobile phase was used as the diluent to prepare 1 mg/ml samples. We injected 10 ml of each sample into the HPLC system, the purity of the synthesized N-nitrosochlordiazepoxide was 97.0%, and the purity of the key starting material chlordiazepoxide hydrochloride was 99.90%, as shown in Figure 4.
Peak Purity Analysis using Photodiode array detector (PDA)-HPLC
The observed peak purity index of N-nitrosochlordiazepoxide was 0.999993, there was no impurity detected in the main peak, the minimum peak purity index was 147, and the purity curve was above the zero line, which indicates that the peak was spectrally pure, as shown in Figure 5.
Method development (LC-MS/MS)
Preparation of the impurity stock solution
After precise weight measurements, N-nitrosochlordiazepoxide (10 mg) was dissolved and subsequently diluted in 100 ml of methanol, to attain a concentration of 100 ppm. Following this, a 3 ppm impurity stock solution was prepared by transferring 3 ml of the solution to a 100 ml volumetric flask and diluting it with methanol.
Preparation of the impurity standard solution
From the impurity stock solution (3 ppm), a series of linear dilutions were prepared to generate impurity standard solutions with concentrations of 0.18 ppm, 0.375 ppm, 0.75 ppm, 1.20 ppm, 1.50 ppm, and 2.25 ppm.
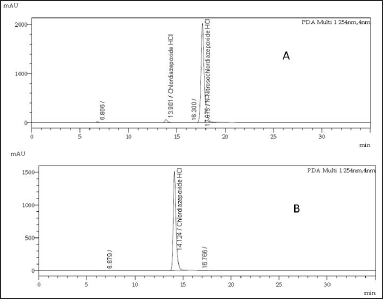 | Figure 4. HPLC chromatograms of (A) N-nitrosochlordiazepoxide hydrochloride (97.0% purity) and (B) key starting material chlordiazepoxide hydrochloride (99.90% purity). [Click here to view] |
Preparation of spiked sample solution
We prepared spiked samples by adding 10 mg of chlordiazepoxide hydrochloride API to 10–ml standard flasks. The API was dissolved and diluted to volume using impurity standard solutions at 50%, 80%, 100%, and 150% concentrations, corresponding to the quantification limit.
Method optimization and chromatographic column selection
To refine analytical methods, various HPLC columns featuring distinct stationary phases were scrutinized for their efficacy in achieving optimal separation. Specifically, a C18 HPLC column, length of 15 cm, inner diameter of 0.46 cm, and 5µm particle size, C18 column length of 100 cm, 0.4 cm inner diameter, and particle size of 5µm, and a C8 column length of 15 cm, inner diameter 0.46 cm with a 5µm particle size were evaluated. The evaluation encompassed assessments of separation efficiency and sensitivity.
After extensive experimentation, the Shimadzu Zest Column was identified as the preferred option, with dimensions matching those of the previously mentioned C18 HPLC column (15 cm in length, inner diameter 0.46 cm, and particle size 5 µm). Multiple iterations were conducted to refine the methodology, particularly optimizing chromatographic parameters. In this endeavor, diverse LCMS/MS suitable mobile phases were explored, including Ammonium acetate buffers, Formic acid buffers, Ammonium formate, Trifluoroacetic acid buffer, as well as organic mobile phases such as Acetonitrile and methanol. Each mobile phase was scrutinized for its ability to facilitate efficient separation while ensuring compatibility with the LCMS/MS system. Through rigorous experimentation and evaluation, the optimal combination of the mobile phase and chromatographic column has been determined, laying the foundation for robust and reliable LCMS/MS methods in subsequent studies.
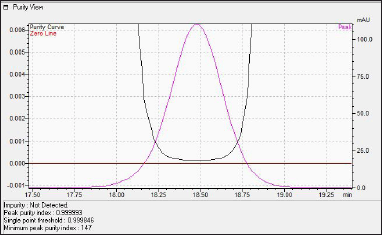 | Figure 5. HPLC Photodiode array detector (PDA) peak purity view of N-nitrosochlordiazepoxide. [Click here to view] |
The final optimized LCMS/MS chromatographic conditions
To prepare mobile phase-A, a mixture of 40% HPLC-grade water and 60% HPLC-grade methanol was combined with 0.2% formic acid, while mobile phase-B consisted of 100% acetonitrile. Chromatographic separation was accomplished employing a Shimadzu zest HPLC C18 Column of length 15 cm, inner diameter 0.46 cm, and a particle size of 5 µm, 40°C temperature was set to column oven. The wavelength of UV Detection was selected to 254 nm, while the flow rate of the mobile phase was set to 0.6 ml/minute, and 10 µl of the sample was injected into the system. Cooling was performed at 15°C to maintain stability. A linear gradient program was used, with mobile phase A starting at 60% and mobile phase B at 40%. The acquisition was performed in MRM mode under positive polarity, with a run time of 10 minutes. At 4.5 kV, the interface voltage was set, utilizing an electron spray ionization (ESI) source interface at a temperature of 300°C. Further desolvation was achieved at a temperature of 526°C, with the desolvation line temperature set to 250°C. The nebulizer gas flow was adjusted to 3.00 l per minute, the heating gas flow was adjusted to 10.00 l per minute, and the 400°C temperature was set to the heating block. The drying gas (nitrogen) flow was maintained at 10.00 l per minute. Impurity is introduced into the mass detector using a flow line selection-switching valve. These meticulously optimized conditions ensure precise separation and efficient detection in LC-MS/MS analysis, facilitating accurate results in analytical studies.
RESULTS
Spectroscopic characterization of synthesized N-Nitrosochlordiazepoxide
Ultraviolet-visible spectroscopy (UV-VIS)
In UV-VIS the chlordiazepoxide hydrochloride and N-nitrosochlordiazepoxide samples were prepared in methanol at a concentration of 0.005 mg/ml and scanned in the range of 200 nm to 400 nm, the maximum absorbance was recorded at 263.30 nm and 243.80 nm, respectively, for the chlordiazepoxide hydrochloride sample, as shown in Figure 6. UV?visible (A) and maximum absorbance were recorded at 291.0 nm and 238.3 nm, respectively, for the N-nitrosochlordiazepoxide sample, as depicted in Figure 6 B.
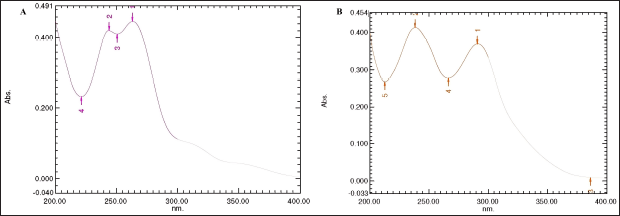 | Figure 6. Ultraviolet-visible spectra of chlordiazepoxide hydrochloride (A) and (B) N-nitrosochlordiazepoxide. [Click here to view] |
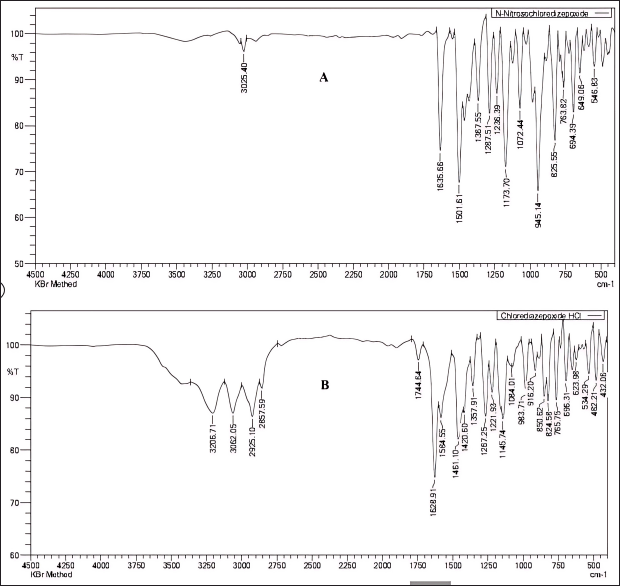 | Figure 7. Comparison of Fourier transform infrared spectra: (A) N-nitrosochlordiazepoxide and (B) Chlordiazepoxide Hydrochloride. [Click here to view] |
FTIR spectroscopy
FTIR analysis was conducted by combining 2 mg of the sample with 200 mg of potassium bromide, followed by thoroughly grinding it with an agate mortar and pestle, and then compressing it with a hydraulic press to form a thin and transparent pellet. The pellet was placed in the FTIR and scanned in the infrared region 400 cm−1–4,500 cm−1, and the spectrum of the synthesized materials revealed the distinct stretching vibrations associated with the N = O nitroso group at a wave number of 1,501 cm−¹ and N–O bonds at 945 cm−1 as shown in Figure 7.
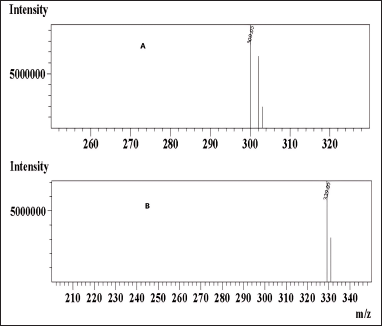 | Figure 8. Mass spectrum (A) chlordiazepoxide and (B) N-nitrosochlordiazepoxide. [Click here to view] |
Mass spectroscopy
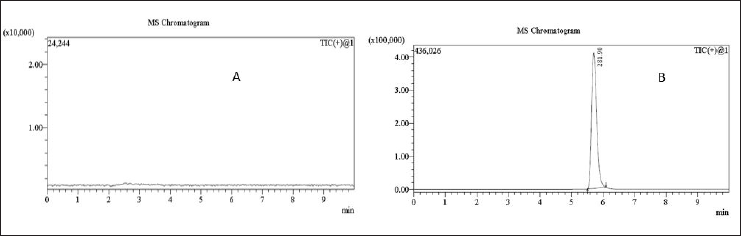
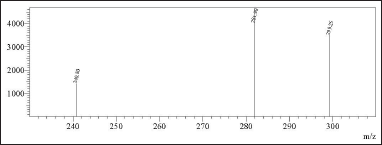
In mass spectrometry, the resulting mass?charge ratios of the synthesized N-nitrosochlordiazepoxide and key starting material chlordiazepoxide were 329.05 [M+H]+ and 300.05 [M+H]+, as shown in Figure 8.
Method validation
Specificity
From the resulting chromatograms of the spiked sample solution, impurity standard solution, sample solution, and blank solution, no interference was detected during the impurity retention period (5.5–6.5 minute). A comparison of these chromatograms confirmed that the method was specific, as demonstrated in Figures 11. and 12.
Precision and intermediate precision
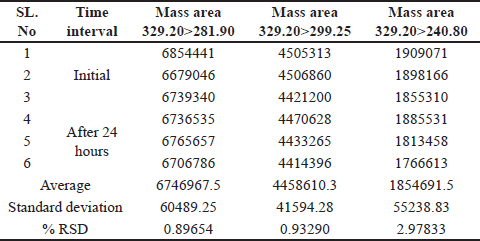
The reproducibility of findings from several measurements made under the same circumstances is called precision. In the context of this method, the precision and intermediate precision were assessed through the analysis of 6 preparations of N-nitrosochlordiazepoxide at a concentration of 1.5 ppm using the developed method. The process utilized MRM transitions, yielding the precursor at m/z 329.20 and the product ions at m/z 281.90, 299.25, and 240.80. The percentage RSD of the mass areas was calculated, and for the main fragment (Q3) m/z 281.90, the method precision was less than 2.3% RSD, and for intermediate precision, less than 1.8% RSD, as shown in Table 1.
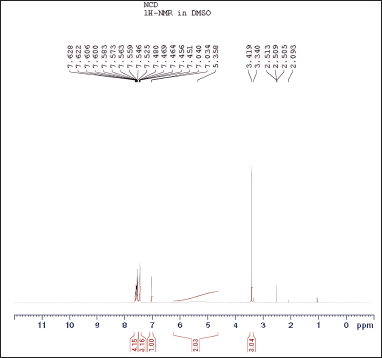 | Figure 9. Proton NMR signals of N-nitrosochlordiazepoxide ranged from 0 to 12 ppm. [Click here to view] |
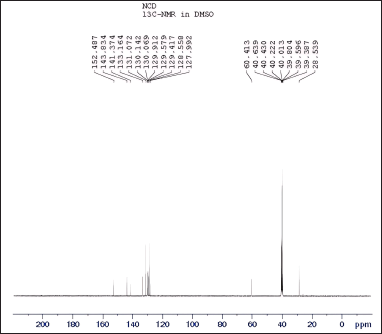 | Figure 10. 13C NMR spectra of N-nitrosochlordiazepoxide at 0-200 ppm. [Click here to view] |
Additionally, intermediate precision was demonstrated by calculating the mean recovery results (25% LOQ, 50%, 100%, and 150%) for both analytes. The percentage RSD for both analysts was less than 2%, as depicted in Table 2. These findings provide evidence of the method’s repeatability and intermediate precision.
Linearity and range
In LC-MS/MS method development, linearity and range are critical factors. Linearity ensures a direct correlation between the analyte concentration and the mass detector response. Calibration curves were constructed for three product ions with m/z values of 281.90, 299.25, and 240.80, showing correlation coefficients falling within the range from 0.9980 to 0.9988.
 | Figure 11. MRM chromatograms of (A) blank solution and (B) 0.18 ppm N-nitrosochlordiazepoxide hydrochloride (LOD) solution. [Click here to view] |
 | Figure 12. MRM spectrum of 1.5 ppm N-nitrosochlordiazepoxide. [Click here to view] |
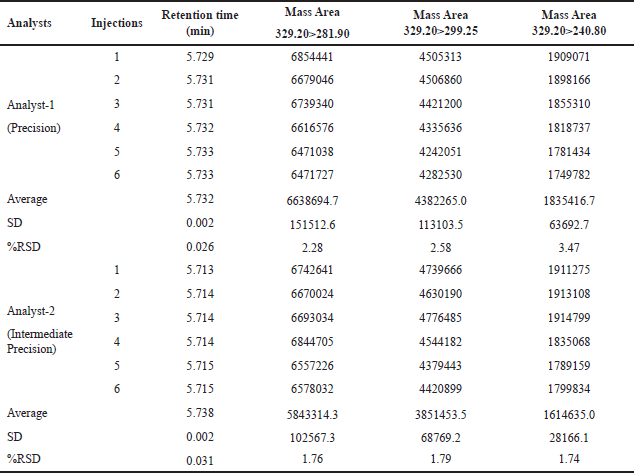 | Table 1. The precision and intermediate precision table contains results from six replicates of the N-nitrosochlordiazepoxide impurity solution (1.5 ppm). [Click here to view |
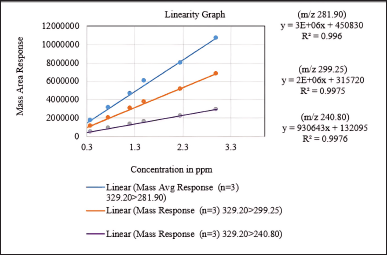 | Figure 13. Linearity graph of the Q3 mass area versus concentration in ppm. [Click here to view] |
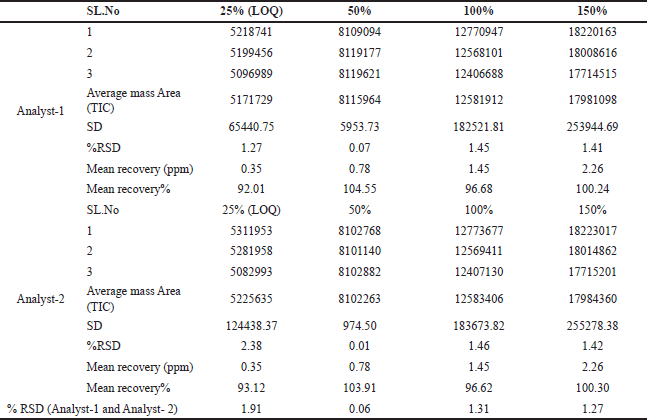 | Table 2. Intermediate Precision 25% LOQ, 50%, 100% and 150% TIC Mass area (n = 3). [Click here to view] |
 | Table 3. The accuracy ranged from 0.375 ppm to 2.3 ppm (n = 3). [Click here to view] |
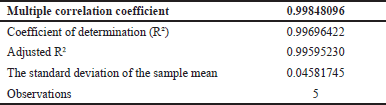
Furthermore, the range determines the concentration range within which the method delivers accurate and precise results, encompassing the lower and upper limits of quantification. The method exhibits linearity between 0.18 ppm and 3.0 ppm in concentration, with the coefficient of determination (R²) ranging from 0.9960 to 0.9976 for all product ions. These results are illustrated in Figure 13, which shows the linearity graph.
Accuracy
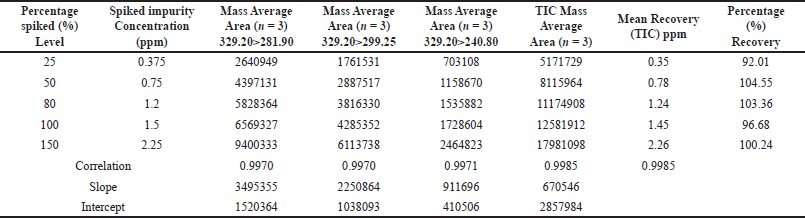
Based on the recovery of the spiked samples, the method accuracy was assessed with concentrations ranging from the LOQ (0.375 ppm) to 150% (2.3 ppm), yielding a mean recovery percentage between 92.01% and 104.55%. A correlation coefficient of 0.9970 to 0.9985 was obtained for all the product-ion and the TIC. These results, as indicated in Table 3, were used to assess the method’s accuracy, and regression statistics are tabulated in Table 4.
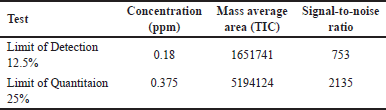
Detection and quantification limits
Based on the signal-to-noise (S/N) ratio, methods with a limit of detection ≥ 3 and quantification limit ≥ 10 were validated, as detailed in Table 5.
Robustness
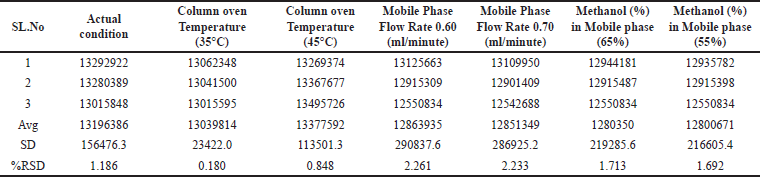
To evaluate the robustness of the method, slight modifications were implemented to the mobile phase composition (±5%), column oven temperature (±5°C), and mobile phase flow rate (±0.05 ml/minute), and the TIC mass area was recorded for the 1.5 ppm impurity spike solution, as displayed in Table 6.
Solution stability
A spiked impurity solution concentration of 1.5 ppm was injected (n = 3), the solution stability was monitored for 48 hours, and no notable alterations were detected in the mass areas of any of the (Q3) product-ion of the impurity standard solutions. Based on these data, the solution was stable for a period of 24 hours. With a percentage RSD less than 4. As shown in Table 7.
At 48 hour, a 20%–24% reduction in the average mass area of all the product ions (m/z) was observed, as shown in Table 8.
Batch analysis
Three batches of chlordiazepoxide hydrochloride were analyzed, and no traces of N-nitrosochlordiazepoxide were detected in any of the samples as shown in Figure 14.
 | Table 4. Regression Statistics from 0.375 ppm to 2.3 ppm (n = 3) versus the TIC Mass Average Area. [Click here to view] |
 | Table 5. The LOD and LOQ mean values (n = 3). [Click here to view] |
 | Table 6. Robustness of the method. [Click here to view] |
 | Table 7. Solution stability for up to 24 hours. [Click here to view] |
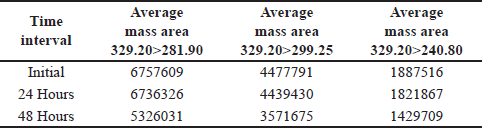 | Table 8. Solution stability for up to 48 hours (n = 3). [Click here to view] |
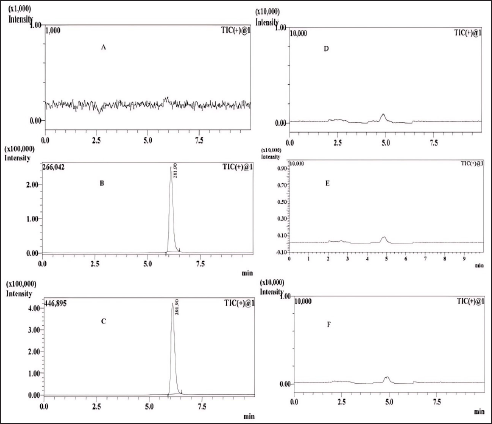 | Figure 14. MRM chromatograms. A is blank, B is the LOD, C is the LOQ, and D, E, and F are sample batches 1, 2, and 3, respectively. [Click here to view] |
DISCUSSION
The formation of PGI in the pharmaceutical drug manufacturing process should be controlled. To understand its structure and formation, we referred to studies conducted by Robbiano et al. [35] and Mereto et al. [36], which involved in vivo experiments with living organisms. However, in our study, we synthesized N-nitrosochlordiazepoxide under controlled laboratory conditions, this approach enabled us to produce N-nitrosochlordiazepoxide from chlordiazepoxide in an acidic environment in the presence of sodium nitrite. We extensively characterized its physical and chemical properties, including solubility, melting point, and various spectroscopic techniques such as UV-VIS, FTIR, mass spectrometry, NMR spectroscopy, and HPLC. Additionally, we employed the Toxtree QSAR tool to explore potential structural activity relationships, determining that the compound falls within potency category 5, with an acceptable daily intake limit of 1,500 ng/day or 1.5 µg/day (1.5 ppm).
Mazzei et al. [42] investigated the products resulting from the interaction between sodium nitrite and chlordiazepoxide hydrochloride using HPLC. The quantification of trace-level impurities is challenging due to the lower sensitivity of the HPLC method compared to LC-MS/MS. However, no method was reported to quantify N-nitrosochlordiazepoxide in chlordiazepoxide using LC-MS/MS. Therefore, we developed a novel, precise, and accurate LC-MS/MS method, validated in compliance with ICH Q2 (R1) guidelines. Our experiment demonstrates the method’s reliability under various conditions, yielding consistent results over time. This research significantly enhances our ability to accurately analyze N-nitrosochlordiazepoxide, ensuring the quality and safety of pharmaceutical products. By addressing analytical limitations and meeting regulatory requirements, our study contributes to improving drug safety and efficacy, ultimately benefiting patient health.
CONCLUSION
In conclusion, after reviewing the study references [34-37], we have selected a synthetic route for the production of N-Nitrosochlordiazepoxide from chlordiazepoxide. This synthetic route capitalizes on the observed formation of N-nitroso impurities under acidic conditions, in the presence of sodium nitrite. The comprehensive characterization of the synthesized compound included analysis of its physical and chemical properties, solubility, melting range, UV spectrum, purity assessment, FTIR analysis, mass spectrometry, and interpretation of 13C and 1H data, furthermore, structural activity relationship assessed using Toxtree QSAR tool.
Additionally, a novel method employing LC-MS/MS was developed for the detection and quantification of N-nitrosochlordiazepoxide, addressing a notable analytical gap in the field. This method underwent rigorous validation following ICH Q2 (R1) guidelines, demonstrating the specificity, detection, and quantification limits, linearity, range, accuracy (recovery), precision, intermediate precision, robustness, and solution stability for a period of 48 hours. This underscores the method’s reliability and suitability for use in the pharmaceutical industry, furthermore, the established method was effectively utilized to analyze chlordiazepoxide hydrochloride samples across three separate batches, all of which did not exhibit any trace of N-nitrosochlordiazepoxide. This method applicability extends beyond API analysis, providing a valuable tool across the pharmaceutical sectors, including process development, quality control, and research aimed at controlling the formation of nitrosochlordiazepoxide impurity in chlordiazepoxide hydrochloride upholding its commitment to ensuring patient safety, the pharmaceutical sector can confidently rely on this robust analytical approach to maintain the quality and integrity of the active drug substance.
LIST OF ABBREVIATIONS
FTIR: Fourier transform infrared spectroscopy; ICH: The International Conference of Harmonization; LC-MS/MS: Liquid chromatography-tandem mass spectrometry;
PDA: Photodiode array detector; PGI: Potential genotoxic impurity; QSAR: Quantitative structural activity relationship; TIC: Total ion chromatogram; UV-VIS: Ultraviolet-visible spectroscopy
ACKNOWLEDGMENTS
The authors extend their sincere thanks to REVA University for its invaluable support. Special recognition goes to Professor Madhusudhana Reddy M.B, and Dr. Syed Mudassar for guidance. Heartfelt appreciation to Flow Chem Pharma Pvt Ltd and Trroy Life Sciences Pvt Ltd for laboratory facilities.
AUTHOR CONTRIBUTIONS
All authors made substantial contributions to conception and design, acquisition of data, or analysis and interpretation of data; took part in drafting the article or revising it critically for important intellectual content; agreed to submit to the current journal; gave final approval of the version to be published; and agree to be accountable for all aspects of the work. All the authors are eligible to be an author as per the International Committee of Medical Journal Editors (ICMJE) requirements/guidelines.
FINANCIAL SUPPORT
There is no funding to report.
CONFLICTS OF INTEREST
The authors report no financial or any other conflicts of interest in this work.
ETHICAL APPROVALS
This study does not involve experiments on animals or human subjects.
DATA AVAILABILITY
All data generated and analyzed are included in this research article.
PUBLISHER’S NOTE
All claims expressed in this article are solely those of the authors and do not necessarily represent those of the publisher, the editors and the reviewers. This journal remains neutral with regard to jurisdictional claims in published institutional affiliation.
USE OF ARTIFICIAL INTELLIGENCE (AI)-ASSISTED TECHNOLOGY
The authors declares that they have not used artificial intelligence (AI)-tools for writing and editing of the manuscript, and no images were manipulated using AI.
REFERENCES
1. López-Muñoz F, Álamo C, García-García P. The discovery of chlordiazepoxide and the clinical introduction of benzodiazepines: half a century of anxiolytic drugs. J Anxiety Disord. 2011;25(4):554–62. CrossRef
2. Greenblatt DJ, Shader RI, MacLeod SM, Sellers EM. Clinical pharmacokinetics of chlordiazepoxide. Clin Pharmacokinet. 1978;3:381–94. CrossRef
3. Salzman G, DiMascio A, Shader RI, Harmatz JS. Chlordiazepoxide, expectation and hostility. Psychopharmacologia. 1969;14:38–45.CrossRef
4. Shemer A, Tykocinski O, Feldon J. Long term effects of chronic chlordiazepoxide (CDP) administration. Psychopharmacology. 1984;83:277–80. CrossRef
5. McNaughton N, Morris RG. Chlordiazepoxide, an anxiolytic benzodiazepine, impairs place navigation in rats. Behav Brain Res. 1987;24(1):39–46. CrossRef
6. Zbinden G, Bagdon RE, Keith EF, Phillips RD, Randall LO. Experimental and clinical toxicology of chlordiazepoxide (Librium®). Toxicol Appl Pharmacol. 1961;3(6):619–37. CrossRef
7. Le Vann LJ. Chlordiazepoxide, a tranquillizer with anticonvulsant properties. Can Med Assoc J. 1962;86(3):123.
8. Rickels K, Downing RW, Howard K. Predictors of chlordiazepoxide response in anxiety. Clin Pharmacol Therap. 1971;12(2part1):263–73. CrossRef
9. File SE. The use of social interaction as a method for detecting anxiolytic activity of chlordiazepoxide-like drugs. J Neurosci Methods. 1980 ;2(3):219–38. CrossRef
10. Gardos GA, DiMascio A, Salzman C, Shader RI. Differential actions of chlordiazepoxide and oxazepam on hostility. Arch Gen Psychiatry. 1968;18(6):757–60.
11. Azima H, Arthurs D, Silver A. The effects of chlordiazepoxide (Librium) in anxiety states: a multi-blind study. Can Psychiatric Assoc J. 1962;7(1):44–50. CrossRef
12. Lorr M, McNair DM, Weinstein GJ. Early effects of chlordiazepoxide (Librium) used with psychotherapy. J Psychiatric Res. 1963;1(4):257–70. CrossRef
13. Choi DW, Farb DH, Fischbach GD. Chlordiazepoxide selectively augments GABA action in spinal cord cell cultures. Nature. 1977;269(5626):342–4. CrossRef
14. Salzman C, Kochansky GE, Shader RI, Porrino LJ, Harmatz JS, Swett CP. Chlordiazepoxide-induced hostility in a small group setting. Arch Gen Psychiatry. 1974;31(3):401–5.
15. Hollister LE, Motzenbecker FP, Degan RO. Withdrawal reactions from chlordiazepoxide (“Librium”). Psychopharmacologia. 1961;2:63–8. CrossRef
16. Reddy AV, Jaafar J, Umar K, Majid ZA, Aris AB, Talib J, et al. Identification, control strategies, and analytical approaches for the determination of potential genotoxic impurities in pharmaceuticals: a comprehensive review. J Sep Sci. 2015;38:764–79. CrossRef
17. Zhong Z, Chen Y, Xia H, Chen Z, Cheng, Q. Development and validation of a sensitive GC-MS/MS method for the determination of five potential genotoxic impurities in abiraterone acetate. J Chromatogr Sci. 2022;60:105–10. CrossRef
18. Grigori K, Loukas YL, Malenovi´c A, Samara V, Kalaskani A, Dimovasili E, et al. Chemometrically assisted development and validation of LC-MS/MS method for the analysis of potential genotoxic impurities in meropenem active pharmaceutical ingredient. J Pharm Biomed Anal. 2017;145:307–14. CrossRef
19. Christofi M, Markopoulou CK, Tzanavaras PD, Zacharis CK. UHPLC-fluorescence method for the determination of trace levels of hydrazine in allopurinol and its formulations: validation using total-error concept. J Pharm Biomed Anal. 2020;187:113354. CrossRef
20. Rao T, editor. Genotoxicology of N-nitroso compounds. Berlin, Germany: Springer Science & Business Media; 2013.
21. International Agency for Research on Cancer. Some N-nitroso compounds. World Health Organization (WHO) Lyon, France. IARC Monographs on the Evaluat; 1978.
22. Brambilla G, Cajelli E, Finollo R, Maura A, Pino A, Robbiano L. Formation of DNA-damaging nitroso compounds by interaction of drugs with nitrite. A preliminary screening for detecting potentially hazardous drugs. J Toxicol Environ Health. 1985;15(1):1–24. CrossRef
23. Brambilla G, Martelli A. Genotoxic and carcinogenic risk to humans of drug–nitrite interaction products. Mutat Res. 2007;635(1):17–52. CrossRef
24. Eichholzer M, Gutzwiller F. Dietary nitrates, nitrites, and N-nitroso compounds and cancer risk: a review of the epidemiologic evidence. Nutr Rev. 1998;56(4):95–105. CrossRef
25. Loh YH, Jakszyn P, Luben RN, Mulligan AA, Mitrou PN, Khaw KT. N-nitroso compounds and cancer incidence: the European prospective investigation into cancer and nutrition (EPIC)–Norfolk study. Am J Clin Nutr. 2011;93(5):1053–61. CrossRef
26. Bartsch H, Ohshima H, Pignatelli B, Calmels S. Endogenously formed N-nitroso compounds and nitrosating agents in human cancer etiology. Pharmacogenetics. 1992;2(6):272–7.
27. Mirvish SS. Effects of vitamins C and E on N-nitroso compound formation, carcinogenesis, and cancer. Cancer. 1986;58(S8):1842–50. CrossRef
28. Knekt P, Järvinen R, Dich J, Hakulinen T. Risk of colorectal and other gastro-intestinal cancers after exposure to nitrate, nitrite and N-nitroso compounds: a follow-up study. Int J Cancer. 1999;80(6):852–6. CrossRef
29. Bogovski P, Bogovski S. Special report animal species in which n-nitroso compounds induce cancer. Int J Cancer. 1981;27(4):471–4. CrossRef
30. Lijinsky W. Chemistry and biology of N-nitroso compounds. Cambridge, UK: Cambridge University Press; 1992.
31. Özhan G, Alpertunga B. Genotoxic activities of drug-nitrite interaction products. Drug Chem Toxicol. 2003;26(4):295–308. CrossRef
32. Coulston F, Olajos EJ. Toxicology of N-nitroso compounds. Ecotoxicol Environ Saf. 1982;6(1):89–96. CrossRef
33. Johnson GE, Dobo K, Gollapudi B, Harvey J, Kenny J, Kenyon M, et al. Permitted daily exposure limits for noteworthy N-nitrosamines. Environ Mol Mutag. 2021;62(5):293–305.
34. Brambilla G, Robbiano L, Martelli A, Cajelli E, Allavena A, Mazzei M. Genotoxicity of N-nitrosochlordiazepoxide in cultured mammalian cells. Toxicol Appl Pharmacol. 1989;97(3):480–8.
35. Robbiano L, Carlo P, Finollo R, Brambilla G. DNA damage induced in rats by oral administration of chlordiazepoxide plus sodium nitrite or of N-nitrosochlordiazepoxide. Toxicol Appl Pharmacol. 1990;102(1):186–90. CrossRef
36. Mereto E, Campart GB, Ghia M, Petrogalli F. Oral administration of chlordiazepoxide plus sodium nitrite investigated for tumor initiating activity in the rat liver. Cancer Lett. 1990;53(1):61–5. CrossRef
37. Takeda Y, Kanaya H. Formation of nitroso compounds and mutagens from transquilizers by drug/nitrite interaction. Cancer Lett. 1981;12(1-2):81–6. CrossRef
38. Agency, E.M. Guideline on the limits of genotoxic impurities. In evaluation of medicines for human use. London, UK: European Medicines Agency; 2006. pp. 1–8.
39. Guidance, F.D. Genotoxic and carcinogenic impurities in drug substances and products: recommended approaches; US Food and Drug Administration. Washington, DC: Department of Health and Human Services; 2008.
40. Guideline, I.H. Assessment and control of dna reactive (mutagenic) impurities in pharmaceuticals to limit potential carcinogenic risk M7. Proceedings of the Geneva, Switzerland: International Conference on Harmonization of Technical Requirements for Registration of Pharmaceuticals for Human use (ICH); 2017. https://www.ema.europa.eu/en/ich-m7-assessment-control-dna-reactive-mutagenic-impurities-pharmaceuticals-limit-potential-carcinogenic-risk-scientific-guideline
41. Fda US. Guidance for industry-recommended acceptable intake limit for nitrosamine drug substances-related impurities (NDSRIs). US Department of Health and Human Services, Food and Drug Administration, Silver Spring, Maryland, USA. Centre for Drug Evaluation and Research (CDER) 2023.
42. Mazzei M, Balbi A, Roma G, Di Braccio M, Robbiano L. HPLC analysis of the nitrosation products of chlordiazepoxide. Farmaco. 1989;44(9):883–91.