
INTRODUCTION
Doxylamine succinate (DXA) is a chemical compound with the molecular structure “N,N-dimethyl-2-[α-methyl-α-(2-pyridyl)benzyloxy] ethylamine hydrogen succinate”. It is a white or off-white powder. As a derivative of pyridine, DXA succinate acts as a histamine H1 receptor antagonist with strong sedative effects. It works by competitively inhibiting the histamine H1 receptor, thereby reducing typical allergic and anaphylactic responses such as bronchoconstriction, vasodilation, increased capillary permeability, and spasmodic contractions of the gastrointestinal smooth muscle. These responses are usually triggered by histamine’s actions on bronchial and gastrointestinal smooth muscles and capillaries. Additionally, this drug alleviates histamine-induced pain and itching of the skin and mucous membranes [1–3]. Pyridoxine hydrochloride (PRD) (Fig. 1) is a chemical compound known as “3-hydroxy-4,5-bis(hydroxymethyl)-2-picoline hydrochloride”. As the 4-methanol form of vitamin B6, PRD is converted into pyridoxal phosphate, a coenzyme essential for the synthesis of amino acids, neurotransmitters, sphingolipids, and aminolevulinic acid. This compound is categorized as a vitamin that can dissolve in water and is essential for numerous metabolic functions, such as the metabolism of amino acids, carbohydrates, and fats. Additionally, it is essential for the synthesis of hemoglobin [4–6]. Tablet formulations of DXA and PRD, which are accessible in the market, play a crucial contribution in managing persistent nausea and vomiting experienced during pregnancy.
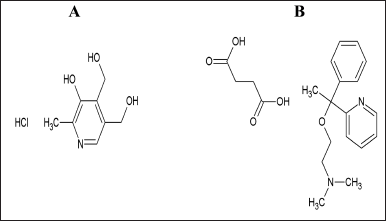 | Figure 1. Structure of PRD (a) and DXA (b). [Click here to view] |
A review of the literature reveals that some studies have reported on RP-HPLC methods for the simultaneous determination of PRD and DXA in pharmaceutical formulations. One RP-HPLC method was developed for the determination of PRD and DOX in a formulation using an ethanol-based mobile phase [7]. At room temperature, ethanol-water solutions have higher viscosities compared to methanol-water and acetonitrile-water solutions with the same elution strength [8]. This leads to increased pressure requirements for chromatographic separations, potentially reducing the lifespan of the column and equipment. Other RP-HPLC methods have also been developed for quantifying substances in bulk and formulations [9–11]. However, the retention time (RT) of PRD in some of these methods was close to the void volume. RT exceeding 2 minutes improves analytical performance, RS, and the reliability and reproducibility of RP-HPLC outcomes. A stability-indicating HPLC method was developed for the estimation of DXA in formulations [12], as well as a stability-indicating HPLC method for estimating PRD and DXA in formulations using a phosphate buffer in the mobile phase [13]. The primary goal of this study was to utilize DOE to develop and validate an RP-HPLC method capable of separating the drug components with enhanced system suitability parameters and RT. Additionally, the developed method is made LC-MS compatible and equipment-friendly through the selection of an ammonium acetate buffer, paving the way for future research extensions. The study also aimed to integrate quality controls during method development to ensure optimal performance throughout the product’s lifespan.
MATERIALS AND METHODS
Reagents
PRD and DXA were obtained as gift samples from Synpure Labs Pvt Ltd, India. The drug formulation BEDOXIN (PRD 10 mg/DXA 10 mg) was procured from the local market. The chemicals used are of analytical grade. Chemicals such as ACN, ammonium acetate, and water are HPLC grade and were procured from Merck (Bangalore, India).
Statistical assessment
The statistical investigation was conducted using Microsoft Excel 2007, encompassing mean, CV, RSD, and linear regression analysis calculations. The software application Design Expert, specifically version 13.0.5.0, was employed for the Analysis of variance (ANOVA), creating 3D response surface plots and optimizing response surfaces.
Instrumentation
HPLC (LC-20AD) from Shimadzu, Japan, with a binary pump equipped with a Photo diode array (PDA) detector, was used for chromatographic separation. A rheodyne injector with a 20 μl loop was used. The data acquisition was done using the LC solution software. A Ultraviolet (UV)/Visible spectrophotometer from Lab India, India, was used for spectroscopic studies. The analytical balance of Mettler Toledo (ML303T) was used for analysis.
Conditions for chromatography
The chromatographic separation was achieved using Waters Symmetry C18 column (250 mm length × 4.6 mm id × 5 μm particle size). The mobile phase with a composition of 0.01 M ammonium acetate buffer and ACN at 35:65 v/v and 1.0 mL/minute flow rate was utilized for separation. A 20 μl sample was injected, and the detection of the eluents was conducted at a wavelength of 254 nm. The operation of the HPLC system was carried out at ambient conditions.
Preparation of standard solutions
Precisely measured amounts of 25 mg each of the pure drug PRD were individually placed into a separate 25 ml calibrated flask. 18 ml of ACN was added to these flasks, followed by a 15-minute sonication period. The volume was adjusted with ACN to reach the designated mark, resulting in individual stock solutions. From the previously prepared stock solutions, serial dilutions were done with the mobile phase to get a working standard solution containing 60 µg/ml of PRD and 60 µg/ml of DXA, respectively. The solutions were then filtered through a 0.45 μm Nylon filter and labeled as standard stock solutions.
Preparation of sample solution
For analysis of BEDOXIN (PRD 10 mg/DXA 10 mg), 20 tablets were weighed and ground in a glass mortar, yielding a powder equivalent to 25 mg of PRD and 25 mg of DXA, which was then transferred to a 25 ml volumetric flask. Approximately 18 ml of solvent was added, and the mixture was sonicated for 20 minutes to ensure complete dissolution. The resulting solution was serially diluted with ACN to achieve a concentration of 60 μg/ml and 60 μg/ml of PRD and DXA, respectively. This solution was then spiked with PRD and DXA concentrations ranging from 80% to 120% of specification levels and subjected to further sonication for 20 minutes. Afterward, the solution was filtered through a 0.45 μm nylon membrane filter, and the resulting solution was analyzed using the HPLC system. Subsequently, the HPLC system was employed to analyze the resulting solution, and the contents of PRD and DXA were calculated by using a Central Composite design (CCD).
Analytical quality by design based method development
Step 1: Analytical target profile
An analytical target profile helps identify the method development goals. The two APIs in the formulation can be separated simultaneously using HPLC in a reasonable amount of time with improved system suitability parameters, RT and RS. The main objectives were to enhance the chromatographic method by improving parameters such as N, RS, and RT of PRD. Additionally, the aim was to efficiently apply the refined method for quantifying PRD and DXA in a pharmaceutical formulation [14].
Step 2: Risk assessment
In HPLC, the factors, notably the mobile phase and the column design, may affect the effectiveness of the separation. Other factors that may influence the method’s effectiveness include the temperature of the column, detection parameters, sample preparation procedures, and the volume used for injection.
Every analytical stage underwent a thorough assessment, with risks analyzed according to severity, likelihood of occurrence, and ease of detection. While risk assessment may seem straightforward due to its reliance on a mathematical formula (severity * occurrence * detectability), the precise evaluation of each component was guaranteed through the application of sound chromatographic principles and practical experience in the field.
Step 3: Conducting an experiment’s design
Several initial experiments were conducted through trial and experimentation to gain a deeper insight into the method’s performance and pinpoint significant factors influencing the outcome variables. Solvents such as ACN and water were employed to separate PRD and DXA while meeting system suitability criteria effectively. The chromatogram was captured in different mobile phase compositions and flow rates. Establishing an HPLC methodology using A QbD relies on selecting crucial factors and responses, a process facilitated by preliminary trials and evaluating potential risks. The CCD further enhanced the chromatographic conditions. The CCD is an experimental method to extract comprehensive insights about a process with minimal experimentation. By employing a CCD design [15–17] featuring 3 variables factors and 4 response parameters, 17 unique chromatographic conditions were generated (Table 1). Experimental runs were made randomly to lessen the impact of uncontrollable variables on bias. Following extensive investigation, the flow rate, ACN volume, and column oven temperature were determined to be the three most important factors. In separate analytical techniques such as chromatography, critical quality attributes (CQAs) can be associated with the precision and stability of the method, along with system suitability indicators like RT, N, RS, and tailing factor (Tf). In the configuration, the lower and upper limits for the volume of ACN (A) were set at 50 ml and 80 ml, while the flow rate (B) and temperature (C) were maintained within the range of 0.5–1.5 ml/minute and 25°C–55°C, respectively. The collected data underwent evaluation through statistical software known as Design Expert (Version 13.0.5.0, developed by Stat-Ease Inc., Minneapolis, MN, USA).
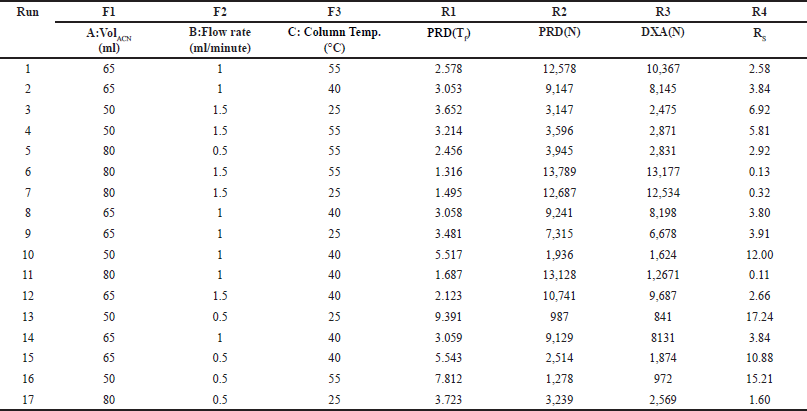 | Table 1. Experimental design domain (CCD) for each run with responses. [Click here to view] |
Step 4: Examination of experimental outcomes and refinement of the method
Design Expert software was utilized to perform a systematic statistical analysis of the experimental results. A design space was created, and statistical techniques, including ANOVA, 3D contour plots, and prediction equations, were used to evaluate each response.
Step 5: Analytical technique performance strategy definition
The overall knowledge of method performance under various experimental circumstances made it possible to build a control strategy to reduce risk and ensure that the approach provides acceptable quality characteristics.
RESULTS AND DISCUSSION
Method development using Quality by Design
The selection of the column phase is vital for achieving the desired separation of analytes. In our study, we chose a C18 column due to its common use in reverse-phase HPLC for non-polar to moderately polar compounds. The C18 column offers excellent retention and RS for PRD and DXA. We opted for a column length of 250 mm to strike a balance between RS and analysis time, as longer columns generally provide better separation. A particle size of 5 µm was selected, which balances performance and column longevity, although smaller particles (3 µm or less) can improve RS and efficiency, they also increase pressure and potential column wear. The ammonium acetate buffer was chosen for the mobile phase because of its compatibility with both HPLC and LC-MS. Ammonium acetate is a volatile buffer, making it ideal for mass spectrometry detection, and it provides sufficient buffering capacity to maintain pH stability, which is crucial for consistent RT and peak shapes. To ensure consistent analyte behavior and reduce the viscosity of the mobile phase, a column oven was used. This minimizes back pressure and enhances column performance. The mobile phase composition was designed to be as effective as possible so that all of the drugs would be separated quickly. Methanol, ACN, and their mixtures were just a few of the mobile phases and ratios investigated to satisfy the system suitability parameters. The retention period of PRD and DXA was improved by a high organic phase in the mobile phase when various ratios of ACN and ammonium acetate buffer were investigated. The ratio of ACN: ammonium acetate (0.01M) buffer 65:35 v/v was superior in every aspect of system suitability parameters. The lower organic phase in a mobile phase was examined. However, it was found that the PRD and DXA peaks widened with the decrease in N. We employed the mobile phase as a diluent to prepare the sample to avoid interference from a solvent. Based on these findings, several exploratory studies evaluating system suitability traits determined that the mobile phase composition of ACN: acetate buffer (0.01M) (65: 35) was adequate. Initial investigations also indicated that variables like volume of ACN (VolACN), flow rate, and column temperature significantly influenced the RT and system suitability parameters like N, Tf, and RS. The CCD approach was employed to enhance chromatographic conditions by taking into account the influences variables on critical aspects such as the RT of PRD (R1), N of PRD (R2), N of DXA (R3), and RS (R4). The ANOVA analysis, accessible within the Design Expert software, was additionally employed to validate the model, and the results are presented in Table 2. The quadratic model for RT of PRD (R1), the quadratic model for N of PRD (R2), the quadratic model for N of DXA (R3), the quadratic model for RS (R4) were chosen based on the sequential p-value of the model and Residual lack of fit p-value. The sequential p-value less than 0.05 indicated a significant effect of the model. The normal plot of residues was demonstrated in Figure 2 which plots externally studentized residuals on the X-axis and average % probability on the Y-axis. The plotted values are within the limits of the cook’s distance. Adequate Precision evaluates the signal-to-noise ratio, favoring a ratio exceeding 4. This model can be effectively employed to explore the design space. The high adjusted R-square value and Low standard deviation (% CV) indicated a good correlation between the fitted models and experimental data. The forecasted and adjusted R-square values exhibited strong agreement across all response parameters. The ultimate equation can be applied to predict the response based on specific levels of each factor and is expressed in terms of natural components and factors in the following manner: RT of PRD (R1) = 3.12611 + −1.8909 * A + −1.7125 * B + −0.4366 * C + 0.871125 * AB + 0.071375 * AC + 0.278625 * BC + 0.451303 * A^2 + 0.682303 * B^2 + −0.121197 * C^2, N of PRD (R2) = 9,268.75 + 3,584.4 * A + 3,199.7 * B + 781.1 * C + 1,851.75 * AB + 133.5 * AC + 69.25 * BC + −1,809.06 * A^2 + −2,713.56 * B^2 + 605.444 * C^2, N of DXA (R3) = 8,237.04 + 3,499.9 * A + 3,165.7 * B + 512.1 * C + 2,097.25 * AB + 47.25 * AC + 80.75 * BC + −1,148.82 * A^2 + −2,515.82 * B^2 + 226.176 * C^2, RS (R4) = 4.31448 + −5.20961 * A + −3.20053 * B + −0.335203 * C + 1.95482 * AB + 0.534114 * AC + −0.0730682 * BC + 1.37981 * A^2 + 2.09587 * B^2 + −1.42751 * C^2. A positive value signifies that the optimization has led to improvements, while a negative value implies an inverse relationship between the factor and the response. The response surface and perturbation plots were created to assess the impact of the variables on chosen responses. Perturbation plots reflect the variation in a variable’s response from its nominal value, and the curvature indicates the factor’s magnitude. The observed outcomes for the enhanced chromatographic conditions closely aligned with the predicted values, leading to a minimal error margin and a high desirability level. Contour plots and three-dimensional surface plots are especially useful for assessing how factors interact and affect the response (Figs. 3and 4). The plots showed curvature, suggesting a quadratic relationship between the factors and the responses.
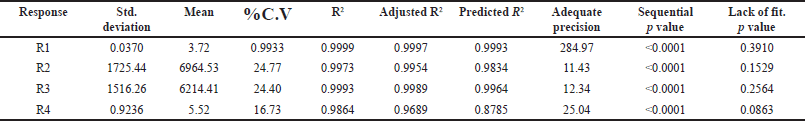 | Table 2. ANOVA for quadratic models. [Click here to view] |
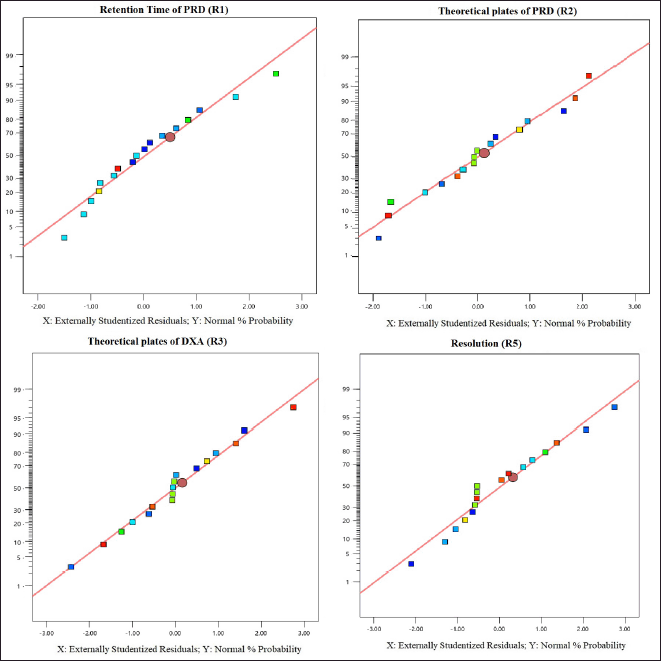 | Figure 2. Normal plots of residuals from R1 to R4. [Click here to view] |
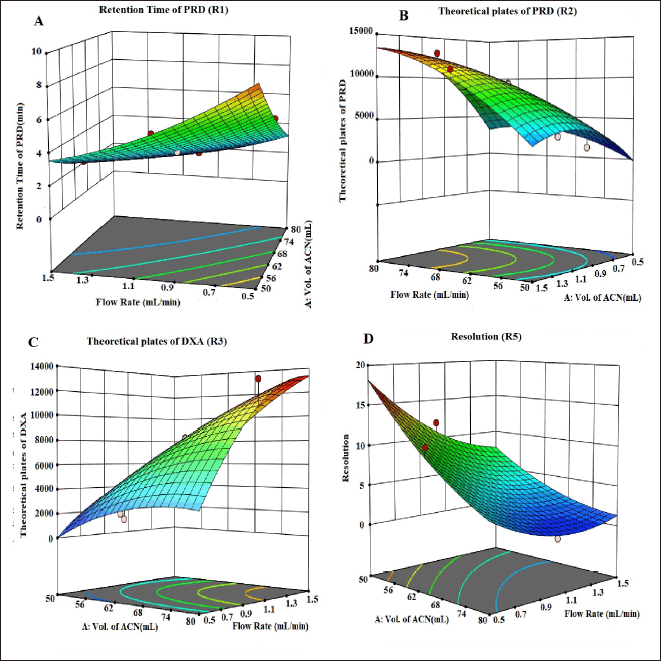 | Figure 3. 3D counter plots showing the effect of factors on responses A) RT of PRD, B) N of PRD, C) N of DXA, and D) Resolution. [Click here to view] |
 | Figure 4. 2D plots for desirability and responses. [Click here to view] |
Design space
The primary goal in method development is to establish a design space for the method. The goal for Response-1, RT of PRD selected is not less than 3.0 and for Responses-2 and 3; the N of PRD and DXA is not less than 5,000, respectively, RS selected is between 3 and 5. Figure 5 displays the design space of the CCD experiments based on the chosen objectives.
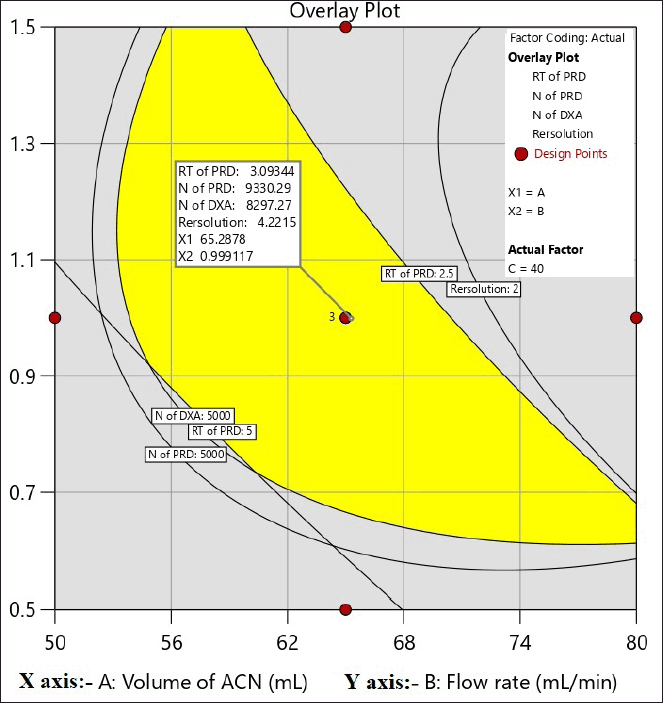 | Figure 5. Design space for a CCD experiment. [Click here to view] |
Optimized method
Upon examining the DOE solutions, it was found that the optimal chromatographic conditions included a mobile phase-B consisting of 65% ACN, a flow rate of 1 ml/minute, and a column temperature of 40°C. The design space for the optimized conditions with chromatogram is a good design space between 62 and 68 percent ACN, 40°C for the column temperature, and 0.7–1.1 ml/minute for the flow rate. It was demonstrated that the responses were unaffected by the total effect of the chosen parameters. Hence, it was shown that, under robust conditions, the optimized method parameters are within the method operable design region, ensuring the quality of the developed procedure. The results of the predicted optimal value and experimental value with the error for the responses are reported in Table 3. The resultant chromatogram is shown in Figure 6.
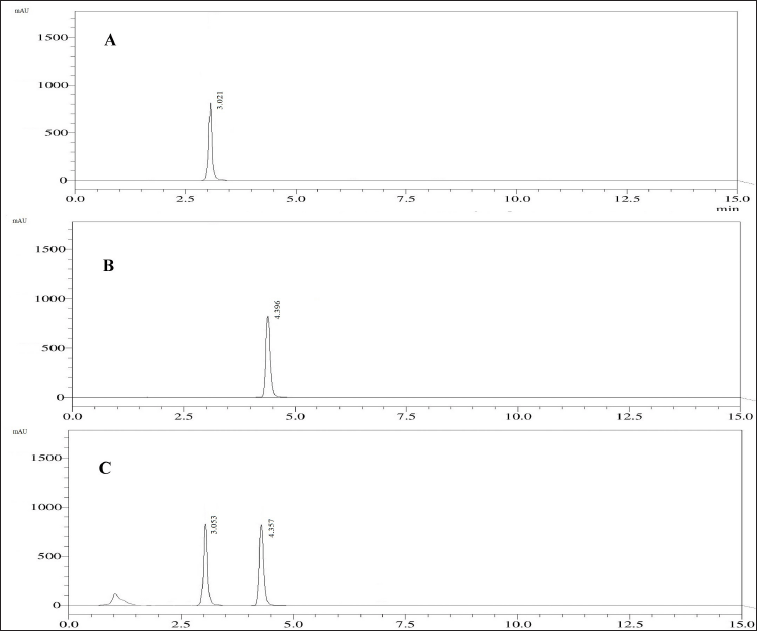 | Figure 6. Chromatogram from the standard solution containing 60 μg/ml of PRD (A) and 60 μg/ml of DXA (B), and the sample formulation with 60 μg/ml of PRD and 60 μg/ml of DXA (C). [Click here to view] |
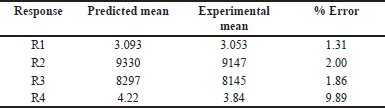 | Table 3. Predicted value versus experimental value. [Click here to view] |
System suitability study
Once the optimum chromatographic conditions for the developed method were established, the system suitability parameters were estimated and compared regarding acceptable limits. The parameters were determined to fall within the acceptable range limits, confirming their suitability for the analysis (Table 4).
 | Table 4. System suitability parameters. [Click here to view] |
Method validation
From the observation of UV spectra, PRD and DXA have a good absorbance at 254 nm. Therefore, 254 nm was chosen as the analytical wavelength for detection. Figure 4 shows a chromatogram of individual standards and formulation samples. The optimized method underwent validation by the guidelines outlined in ICH Q2 (R1), covering parameters including linearity, precision, accuracy, and robustness. The validation test results are documented in Table 5.
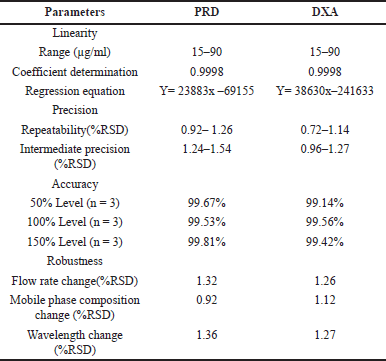 | Table 5. Results of validation studies. [Click here to view] |
Linearity
Calibration curves for PRD and DXA were constructed across concentration ranges of 15–90 µg/ml and 15–90 µg/ml, respectively. The regression equation for PRD was determined as 158034x + 61608, exhibiting a correlation coefficient of 0.9998. Similarly, the regression equation for DXA was calculated as 160366x + 30838, with a correlation coefficient of 0.9998. The linear regression analysis of the calibration curves for both drugs revealed a robust linear response within the specified concentration range. These linear curves can effectively quantify PRD and DXA in pharmaceutical formulations.
Precision
The Repeatability and intermediate precision studies were carried out with three replicates of three different concentrations with different days performed (30, 60, and 90 μg/ml for PRD 30, 60, and 90 μg/ml for DXA), and % RSD was calculated. For both repeatability and intermediate precision, the % RSD was below 2%, suggesting that the method has appropriate precision.
Accuracy
To judge the quality and applicability of the method, recovery analysis was performed at three levels: 80%, 100%, and 120% by the standard addition method. The % recoveries for PRD and DXA were calculated and found to be within the limits. Each concentration level was subjected to triplicate analysis. The findings from the recovery studies indicated that the recovery rates for both PRD and DXA fell within the range of 99.14%–99.81%.
Limit of Detection(LOD) and Limit of Quantification(LOQ)
Using the standard deviation approach, LOD and LOQ of PRD and DXA were assessed. Based on the response’s standard deviation (σ) and calibration curve’s slope (S), LOD was determined at 3.3 σ /S and LOQ at 10 σ /S. Results showed that the LOD and LOQ for PRD were 1.24 and 3.76 μg/ml, while those for DXA were 1.18 and 3.58 μg/ml.
Robustness
Minor variations in method parameters did the robustness study to study whether the deliberate changes influence the response. The influence of changes in the flow rate (0.9 and 1.1 ml/minute), ACN composition in the mobile phase (64 and 66 ml), and detection wavelength (253 and 255 nm) were studied and also examined for sonication time (from 10 to 30 minutes duration) at the 20 minutes interval opted for significant results. The results of the recovery of the analyte were evaluated. The method’s robustness was confirmed by observing that the system suitability results remained within the specified limits, even when deliberate modifications were made. To assess the stability of the sample formulation solutions, analysis was conducted at four different time points: 0 hour, 12 hours, 24 hours, 36 hours, and 48 hours as provided in Table 6. The stability samples of formulation did not exhibit any noticeable changes, and the results fell comfortably within the significant range with RSD values are below 2%.
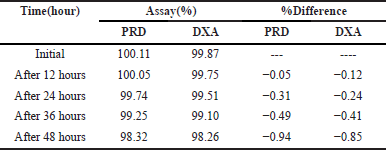 | Table 6. Formulation solutions stability data of PRD and DXA. [Click here to view] |
Assay of pharmaceutical formulation
The developed method was applied to analyze a tablet dosage form containing PRD and DXA as active ingredients. The percentage of the assay was calculated as per areas of sample and standard peaks with respect to concentrations of standard and sample along with purity of standard. The results indicated by the mean percentage exhibited a favorable concordance with the label-claimed values for PRD and DXA. Based on the mean percentage results and the RSD values, as presented in Table 7, it can be inferred that the proposed method is suitable for quantifying PRD and DXA in commercially available tablet formulations.
 | Table 7. Analysis of PRD and DXA in commercial formulation. [Click here to view] |
Forced degradation study
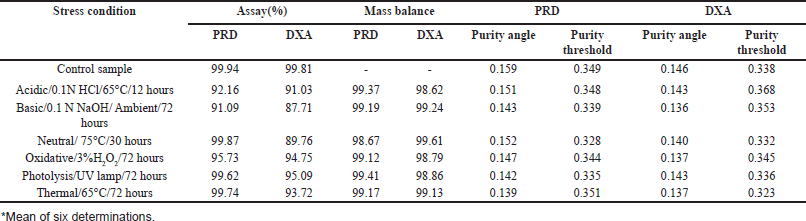
The study examined the degradation behavior of the formulation sample under various stress conditions using liquid chromatography analysis. The results, shown in Figure 7, indicated that 7.84% of PRD and 8.97% of DOX degraded during acid tests. In alkaline conditions, 8.91% of PRD and 12.3% of DOX underwent degradation. The neutral degradation tests showed no significant degradation of PRD, but 10.24% of DOX was degraded. In oxidative conditions, PRD showed 4.27% degradation, whereas 5.25% of DOX degraded. Similarly, no significant degradation was observed for PRD in photolytic and thermal tests, while DOX showed degradation of 4.91% and 6.28%, respectively. The detailed degradation data is available in Table 8.
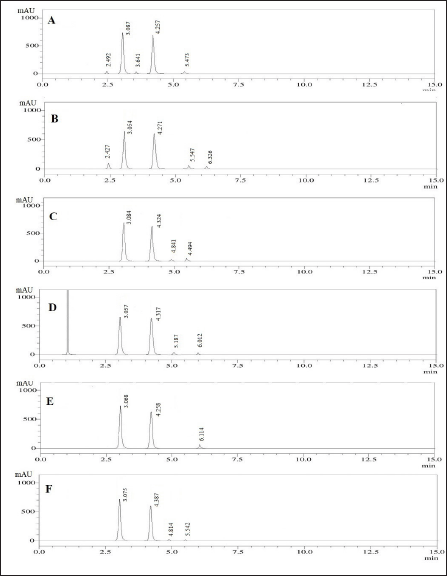 | Figure 7. The stress degradation chromatograms under conditions: A) Acidic, B) Basic, C) Neutral, D) Oxidation, E) Photolytic, and F) Thermal stress. [Click here to view] |
 | Table 8. Forced degradation data. [Click here to view] |
CONCLUSION
A sensitive, reliable, accurate, and precise HPLC analytical procedure utilizing the A QbD approach has been developed to assess PRD and DXA in tablet dosage form simultaneously. To provide the perfect analytical method, the experimental design used the A QbD technique to enable concurrent assessment of the selected factors, including interactions with critical quality attributes. The mobile phase composition, flow rate, and column temperature were found to be the most essential factors for the variables RT, N, and RS by CCD. It was discovered that the number of tests required for the HPLC method development can be decreased by applying the systematic design of experiments. This means that the greatest data may be acquired in the quickest amount of time with the fewest experiments. The high recovery rate in the formulation suggests that the excipients are not interfering with the determination. The validation study showed that the RP-HPLC method was precise, linear, exact, and durable, which supported the selection of the optimal conditions. As a result, the same method may be used to estimate PRD and DXA in the marketed formulations.
ACKNOWLEDGMENTS
The authors thank the Management of the Vignan Institute of Pharmaceutical Technology, for providing laboratory facilities for performing experimental work.
LIST OF ABBREVIATIONS
ANOVA: Analysis of variance; AQbD: Analytical quality by design; CCD: Central Composite design; DXA: Doxylamine; ICH: International Council for Harmonization; PRD: Pyridoxine; PDA: Photo diode array; QbD: Quality by design; UV: Ultraviolet; F1: Factor 1; F2: Factor 2; R1: Response 1; R2: Response 2; R3: Response 3; R4: Response 4; CV: Standard deviation; µg/mL: microgram per liter; RT: Retention time; Tf: Tailing factor; N: Theoretical Plates; RS: Resolution; VolACN: Volume of ACN; h: hour.
AUTHOR CONTRIBUTIONS
All authors made substantial contributions to conception and design, acquisition of data, or analysis and interpretation of data; took part in drafting the article or revising it critically for important intellectual content; agreed to submit to the current journal; gave final approval of the version to be published; and agree to be accountable for all aspects of the work. All the authors are eligible to be an author as per the International Committee of Medical Journal Editors (ICMJE) requirements/guidelines.
FINANCIAL SUPPORT
There is no funding to report.
CONFLICTS OF INTEREST
The authors report no financial or any other conflicts of interest in this work.
ETHICAL APPROVALS
This study does not involve experiments on animals or human subjects.
DATA AVAILABILITY
All data generated and analyzed are included in this research article.
PUBLISHER’S NOTE
All claims expressed in this article are solely those of the authors and do not necessarily represent those of the publisher, the editors and the reviewers. This journal remains neutral with regard to jurisdictional claims in published institutional affiliation.
USE OF ARTIFICIAL INTELLIGENCE (AI)-ASSISTED TECHNOLOGY
The authors declares that they have not used artificial intelligence (AI)-tools for writing and editing of the manuscript, and no images were manipulated using AI.
REFERENCES
1. Nuangchamnong N, Niebyl J. Doxylamine succinate–pyridoxine hydrochloride (Diclegis) for the management of nausea and vomiting in pregnancy: an overview. Int J Women’s Health. 2014 Apr 12;6:401–9. 2 Cada DJ, Demaris K, Levien TL, Baker DE. Doxylamine succinate/pyridoxine hydrochloride. Hospital Pharm. 2013 Sep;48(9):762–6.
3. National Library of Medicine (US), National Center for Biotechnology Information; 2004-. PubChem Compound Summary for CID 11224, Doxylamine Succinate; [cited 2024 Aug. 2].
4. Aufiero E, Stitik TP, Foye PM, Chen B. Pyridoxine hydrochloride treatment of carpal tunnel syndrome: a review. Nutr Rev. 2004 Mar 1;62(3):96–104.
5. Adams PW, Wynn V, Rose DP, Seed M, Folkard J, Strong R. Effect of pyridoxine hydrochloride (vitamin B6) upon depression associated with oral contraception. Lancet. 1973 Apr 28;301(7809):897–904.
6. National Library of Medicine (US), National Center for Biotechnology Information; 2004-. PubChem Compound Summary for CID 1054, Pyridoxine; [cited 2024 Aug. 2].
7. Abd El-Hadi HR, Eltanany BM, Zaazaa HE, Eissa MS. HPLC-DAD approach for determination of pyridoxine HCl and doxylamine succinate in pure and pharmaceutical dosage forms: a green stability-indicating assay method. Microchem J 2022 Jan 1;172:106982.
8. Ribeiro RL, Bottoli CB, Collins KE, Collins CH. Reevaluation of ethanol as organic modifier for use in HPLS-RP mobile phases. J Brazil Chem Soc. 2004;15:300–6.
9. Giriraj P, Sivakkumar T. Development and validation of a rapid chemometrics assisted RP-HPLC with PDA detection method for the simultaneous estimation of Pyridoxine HCl and Doxylamine succinate in bulk and pharmaceutical dosage form. Chromatogr Res Int. 2014;2014(1):827895.
10. Krishna VS, Veni KS, Vijay K, Murali B, Krishna KB, Babu, HS. Development and validation of liquid chromatographic method for the simultaneous estimation of doxylamine succinate, pyridoxine hydrochloride and folic acid in the combined dosage form. World J Pharm Pharm Sci. 2014;April 3(3):78–85.
11. Argekar AP, Sawant JG. Simultaneous determination of pyridoxine hydrochloride and doxylamine succinate from tablets by ion pair reversed-phase high-performance liquid chromatography (RP-HPLC). Drug Dev Indus Pharm. 1999 Jan 1;25(8):945–50.
12. Harde MT, Lakade SH. A stability-indicating HPLC method for estimation of doxylamine succinate in tablets and characterization of its major alkaline stress degradation product. Fut J Pharm Sci. 2021 Dec;7:1–3.
13. Roy D, Chandra P, Ghosh M, Mondal A, Dagur P, Patel MA, et al. A Stability indicating assay method for the simultaneous estimation of Doxylamine succinate and Pyridoxine hydrochloride in bulk and combined dosage form. Res J Pharm Technol. 2023;16(10):4559–67.
14. Koppisetty BR, Prasad YR, Amgoth KM, Yarraguntla SR, Dadi V, Tatapudi HK. Utility of quality by design approach in rp-hplc method development for quantification of lamivudine and effavirenz in combination formulation. J Facult Pharm Ankara Univ. 2023 May 1;47(2):625–36.
15. Koppisetty BR, Tatapudi HK, Dadi V, Gayathri PR, Komali P, Challa GN, et al. QbD based RP-HPLC method for simultaneous determination of a emtricitabine, tenofovir diproxil fumarate and efavirenz in tablet dosage form-an application to stability indicating assay. Anal Chem Lett. 2023 May 4;13(3):267–88.
16. Koppisetty BR, Kollabathula VR, Challa GN, Yarraguntla SR. Quality by design-assisted RP-HPLC method for determination of Ritonavir and Darunavir in pharmaceutical formulation using central composite design. Sep Sci Plus. 2024;7:e202300210.
17. Dadi V, Medapati S, Baratam JK, Tatapudi HK, Challa GN, Yarguntla SR, et al. Quality by design assisted rp-hplc method for estimation of teriflunomide and its process impurities in drug substance. J Fac Pharm Ankara. 2024;48(3):18.
18. Koppisetty BR, Yejella RP, Pawar AK, Yarraguntla SR, Kollabathula VR, Dadi V, et al. Development of a validated RP-HPLC assay method for quantitative separation of Teriflunomide and its process-related impurities in bulk drugs. J Appl Pharm Sci. 2023 Sep 20;13(1):028–33.
19. Koppisetty BR, Yejella RP, Pawar A, Yarraguntla SR, Dadi V, Naidua CG. A Sensitive azeotropic solvent screening head space gas chromatographic method for teriflunomide drug substance. Curr Trends Drug Disc Dev Deliv. 2023 Dec 15;358:258.
20. Guideline IH. Validation of analytical procedures Q2 (R1). Geneva, Switzerland: ICH; 2022.
21. Vasudha D, Naidu CG, Koppisetty BR, Yarraguntla SR, Gullapudi TR. A quality by design assisted RP-HPLC method utilizing central composite design for the assay of eliglustat and its organic impurities in drug. Anal Chem Lett. 2024 Sep 28;14:1–15.