
INTRODUCTION
Although significant advancements have been adopted for the treatment of cancer, it still remains a major cause for the death of affected people. Due to poor survival rates and associated side effects in conventional cancer therapies, the current focus is on novel drugs and biological molecules from natural sources like microbes. Many of pigments from microbes have significant clinical application, including antibiotic, antimalarial, immunosuppressive, and anticancer activities (Soliev et al., 2011). For example, anthracyclines (such as doxorubicin), bleomycin, dactinomycin (actinomycin), and mitomycin C were included in the class of antitumor antibiotics from microbes (Cragg et al., 2009). Hence, in our pursuit of an alternative therapeutic anticancer compound, for the present study, we isolated a yellow pigmented compound from Micrococcus terreus, evaluated the cytotoxic properties against various cancer cell lines, and partially characterized the pigment having the potential for anticancer applications.
MATERIALS AND METHODOLOGY
Cancer cell lines used
The cancer cell lines such as HeLa (cervical), HepG2 (liver), Jurkat (leukemia), and Chinese Hamster Ovary (CHO) cells were received from the National Center for Cell Sciences (Pune, India) and cultured using Dulbecco’s modified Eagle’s medium (HiMedia, India, REF-AT065A), (Modified Eagles’s Medium, HiMedia, India, REF-AT017A) and Roswell Park Memorial Institute (RPMI)-1640 (HiMedia, AT126A), along with 10% fetal bovine serum (FBS, REF-RM112, from HiMedia), streptomycin (100 µg/ml), and penicillin (100 U/ml). By routine subculturing, the cells were maintained at 37°C in a humidified CO2 incubator (Thermo Fisher Scientific, Waltham, MA).
Lymphocyte isolation
Lymphocyte isolation was as per the ethical guidelines for research of theIndian Council of Medical Research (2006). HiSepTM (HiMedia, REF-LS001) was used as per the protocol given in the instruction manual [HiSepTM lymphocyte separation medium (LSM) 1077] for this purpose. Briefly, blood was collected from healthy volunteers in blood collection tubes containing anticoagulant (ethylenediamine tetraacetic acid), mixed gently by inverting the tube two to three times and a 1:2 dilution of whole blood was made in isotonic phosphate buffered saline. 2.5 ml of HiSep™ LSM was aseptically introduced to a 15 ml clean centrifuge tube to which 7.5 ml diluted blood was added very carefully (without mixing). The ratio of LS001 to diluted blood is 1:3. At the room temperature of 15°C–25°C, this was centrifuged at 1,000 g without any brake for 30 minutes. Erythrocytes and WBCs will settle and lymphocytes will be seen as a band above HiSep™ LSM. The supernatant above the interface band comprising plasma and platelets was discarded by aspirating (the red pellet will have granulocytes and erythrocytes). Lymphocytes in the band were aspirated carefully and transferred to a clean, sterile, centrifuge tube and 10 ml of isotonic phosphate buffered saline was added, followed by gentle mixing. For 10 minutes, it was centrifuged at 300–400 g (15°C–25°C). This washing step was repeated once again and the cells (lymphocytes) were cultured in 10% FBS supplemented RPMI 1640 medium, 5 g/ml phytohemagglutinin in a 5% CO2 incubator at 37°C. Lymphocytes were the normal control cells used for cytotoxicity assessment of the sample (Nadumane et al., 2013).
Isolation of bacteria
From different locations, such as Lalbagh, road side, cow dung, and cow urine in and around Bangalore, diverse soil samples were collected and serially diluted, and the spread plate technique was used for bacterial isolation. Soil sample (1 g) was used for this purpose. From each dilution, 1 ml was spread plated on to sterile pre-set Nutrient Agar (NA) media (Aneja, 2003). Colonies of bacteria that were colored were chosen to maintain pure cultures in NA slants.
Identification of bacterial isolates
From the chosen bacterial sample, genomic DNA was extracted using the kit as per the instructions given in the kit manual (Chromous Biotech Pvt. Ltd., Bangalore, India). Briefly, 100 mg of bacterial culture was taken; suspension buffer was added (750 µl) and crushed to a paste using a pestle and mortar. After adding 5 µl of the RNase A solution, it was mixed five to six times by inverting the vial and later keeping it at 65°C for 10 minutes. 1 ml of lysis buffer was used to mix it thoroughly, and the mixture was kept for 15 minutes at 65°C. It was then centrifuged at 13,000 g at room temperature (RT) for about 1 minute; the supernatant was collected in a 2 ml vial and 600 µl of the supernatant was loaded to a column and spun at 13,000 g for 1 minute. 1X wash buffer (500 µl) was added to the column and spun under room temperature at 13,000 g for 1 minute. Warm (65°C) elution buffer, about 50 µl, was added to the column and DNA was eluted. This DNA was subjected to polymerase chain reaction (PCR) amplification as per the standard procedure (Sambrook and Russell, 2001). Characterization was carried out by partial amplification of 16S rDNA encoding gene sequence analysis by using universal primer pair. The sequence of universal primers used for PCR amplification and sequencing is as follows: 5′-AGAGTTTGATCMTGGCTCAG-3′ (forward) and 5′-TACGGYTACCTTGTTACGACTT-3′ (reverse primer). Sequence similarity was analyzed by performing NCBI-Basic Local Alignment Search Tool (BLAST) and the phylogenetic tree was obtained using MEGA 7.0 software.
Pigment extraction and purification
By following a standard protocol, the methanolic extraction method was employed for the extraction of the yellow pigment from the bacterial isolate. The crude pigment extract was subjected to fractionation by thin layer chromatography (TLC), making use of the silica gel-coated TLC sheets (60 F 254, Merck) that are available commercially. The solvent system used for fractionation of pigment was toulene and ethyl acetate (9:1). The chromatograms were detected by exposure to the UV light of a UV transilluminator (254 and 366 nm) (Kirchner et al., 1951). The RF value was calculated for each of the bands.
Quantification of the pigment
By using UV-VIS spectrophotometer (Schimadzu, UV 1800, Japan), spectral scanning (200–700 nm) of pigment fraction obtained from TLC was carried out and the absorption maxima (λ-max) were recorded. A standard curve for the purified fraction was plotted to quantify the pigment.
Screening for cytotoxicity through 3-(4, 5-dimethylthiazol-2yl)-2, 5-diphenyl tetrazolium bromide) (MTT assay)
Pigment cytotoxicity of MY3 fraction on the viability and proliferation of HepG2, HeLa, Jurkat, and CHO cell lines and on lymphocytes was determined using the MTT assay as per the standard protocol (Mosmann, 1983). The cells were seeded to 96-well plates (microtiter) for 24 hours in a CO2 incubator at 37°C, for cell adhesion. To the cells, different concentrations of MY3 (0.25, 0.5, 1.0, 5.0, 10.0, and 20.0 µg/ml), dissolved in dimethyl sulfoxide (DMSO) were added, each in triplicates and incubated for a duration of 1, 2, and 3 days (24, 48, and 72 hours) along with DMSO (0.4%) treated to the control cells. Following the indicated incubation period, MTT solution, 20 µl (5 mg/ml), was added to the cells and was incubated in a dark chamber for 3 hours. After the incubation period, DMSO (100 µl) was added; the optical density was recorded at 540 nm in an enzyme-linked immunosorbent assay (ELISA) plate reader and the percentage viability was calculated.
Analysis through fluorescence microscope
Cancer cells were observed under a fluorescence microscope for visualizing the morphology. Cells were cultured overnight in a CO2 incubator at 37°C and later an IC50 concentration of the pigment was added to them for 48 hours. These were harvested by trypsinization and centrifugation, and later stained with 40 µl of acridine orange (AO)/ethidium bromide (EB) dye (100 µg/ml each). The stained cells were photographed after observation under a fluorescence microscope (UV light) (Diaz-Ruiz et al., 2001).
Observation of DNA fragmentation
Cells in their exponential phase were cultured for 24 hours after treating with IC50 concentration of MY3 and harvested by trypsinization (Trypsin, HiMedia, REF-TCL007), centrifugation, and resuspension in phosphate buffered saline. Using a kit (HiPuraTM, REF-MB506), DNA was isolated as per the given standard instructions. The extracted DNA was electrophoresed (0.8% agarose gel) and with the help of a UV transilluminator it was observed (Bangalore Genei).
Assay for caspase-3, 7, and 10 activity
Caspase-3, 7, and 10 activity analysis was carried out with the help of the Caspase Assay Kit (G Biosciences, cat.#786-202B). The absorbance was noted at 405 nm during the onset of the assay (t = 0 minute) and later at regular 15-minute intervals, until a prominent difference in the readings was observed from that at t = 0. The percentage increase in caspase activity was determined as per the following formula:
Caspase activity (%) = (ODcontrol/sample−ODblank)/ODblank × 100
Lactate dehydrogenase (LDH) cytotoxicity
Cytotoxicity due to MY3 treatment was quantitatively analyzed by the activity of LDH that gets released upon cell lysis. Cancer cells after treating with MY3 (20 µg/ml) for 24 hours were collected and assayed for LDH activity following the instructions provided with the Cytoscan LDH assay kit (G Biosciences Ltd, St. Louis, MO). After recording the absorbance at 490 nm in an ELISA plate reader, the cytotoxicity was calculated using the following formula:
Cytotoxicity (%) = OD treated−OD negative control/OD positive control × 100
Characterization through liquid chromatography-mass spectrometry (LC-MS)
The partially purified pigment through TLC was subjected to LC-MS analysis at the National Chemical Laboratories, Pune. The liquid chromatography (LC) separation was carried out in a WATERS HPLC system having a C-18 octadecylsilane column, 2,487 dual λ UV detector, and a binary pump. Prior to their injection to the column, the mobile phase and sample were sterilized by filtration with a polyvinylidene fluoride filter of 0.22 µm pore size. The fractions eluted at different time intervals from LC were further subjected to mass spectrometric (MS) analysis. With a single quadrupole mass spectrometer, MS analysis of the samples was carried out and over a mass range of 50–1,500 m/z, the spectra were collected.
Statistical analysis
All experiments were carried out thrice and the outcomes were expressed as mean ± standard error. The calculation of statistical significance of the results was through one-way analysis of variance making use of the GraphPad Prism 6.01 software. A value of p < 0.05 indicated significant differences.
RESULTS
Isolation of bacteria
Several pigmented bacterial colonies were obtained from various samples collected from different places in Bangalore. Out of these, a yellow pigmented isolate resulted in showing promising cytotoxic properties against Jurkat, HeLa, and HepG2 cell lines and was chosen for further studies.
Identification of the bacterial isolates
The promising isolate of bacteria was identified by molecular methods, i.e., by analyzing the partial DNA sequences through 16S rRNA sequence analysis. When the DNA samples from the isolate were subjected to PCR using universal 16S rRNA primers, a 500 bp product was clearly visible upon electrophoresis in an agarose gel. The partial 16S rRNA sequences obtained were deposited in the NCBI GenBank database with accession number KM386643 (M. terreus JGI 19). The phenogram indicating the phylogenetic relationship between the isolates and closely related species was established using the data from BLAST analysis. The neighbor joining method was used to construct the phylogenetic tree as per the Tamura–Nei model. The comparative phylogenetic analysis using reference strains in the GenBank showing closest match and 99% homology with our isolate was M. terreus V3M1 (Fig. 1). Consequently, the isolate was named as M. terreus JGI 19.
Partial purification by TLC
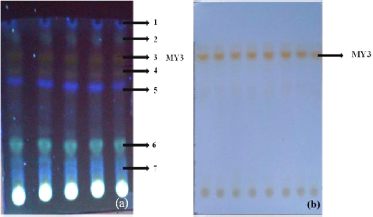
The pigment extract from M. terreus JGI 19 was fractionated using the solvents toulene and ethyl acetate (9:1). Seven fractions were separated from the methanol extract, which are visible under the UV light (Fig. 2a). The third fraction (MY3) was the pigment fraction which was yellow in color, visible under the normal light (Fig. 2b).
| Figure 1. The evolutionary phylogenetic tree of M. terreus JGI 19 using the neighbor joining method. |

Quantification of pigment
The characteristic maxima (λmax) of the pigment collected after TLC was determined by spectrum scanning in a UV-VIS spectrophotometer, and maximum absorbance of the pigment was recorded as 467 nm.
Cytotoxic effect of MY3 on HeLa, HepG2, and Jurkat cell by MTT assay
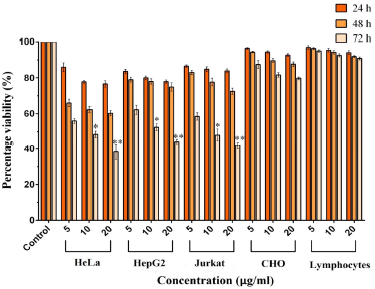
The cytotoxic effect of the yellow colored fraction MY3 from M. terreus on HeLa, HepG2, and Jurkat cell lines were assessed based on the MTT cell viability assay outcomes. The pigment MY3 treatment resulted in exhibiting a concentration and time-dependent cytotoxic effect against all the three cancer cells. Viability of the cancer cells decreased as the period of exposure to the pigment increased from 24 to 72 hours. In all the cell lines treated with MY3 (5.0–20 µg/ml), there was a gradual decrease in percentage viability as the period of exposure increased from 24 to 72 hours (Fig. 3). After 72 hours of treatment with 20.0 µg/ml of MY3, the percentage viability was less than 45% in all the cancer cell lines. Conversely, when CHO cells (normal ovarian cell line) were treated with MY3, upon increasing the treatment concentration from 5.0 to 20.0 µg/ml, the viability percentage was more than 80% at each of the time intervals (24, 48, or 72 hours). So, it was clear that the cytotoxic effect of MY3 was higher to the cancer cell lines HeLa, HepG2, and Jurkat.
As pigment MY3 was found to have a significant anticancer effect on cancer cell lines, it was tested for cytotoxic effects to normal lymphocytes from humans. The viability (%) of peripheral lymphocytes was greater than 85% at all the tested concentrations of MY3 even after 24, 48, and 72 hours and were found to be statistically insignificant when compared to that of the untreated control lymphocytes. These results show that pigment MY3 is non-toxic to normal cells.
The IC50 value of MY3 on HeLa cells for 72 hours was 10.24 µg/ml, on HepG2 cells it was 12.29 µg/ml, and on Jurkat cells it was 11.31 µg/ml from the dose–response curve. The IC50 value of MY3 on CHO cells was more than 50 µg/ml and on lymphocytes it was greater than 100 µg/ml, indicating its specificity toward cancer cells (Table 1).
| Figure 2. (a) TLC separated fractions of pigment from M. terreus JGI 19 under UV light; the arrows indicate fractions 1–7. (b) The arrow indicates a distinct yellow fraction MY3 visible under normal light. |
Fluorescence microscopic analysis
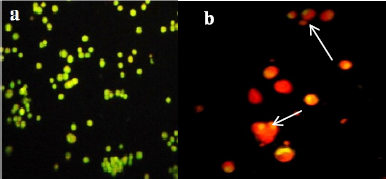
The nucleic acid selective dye, AO, stains both live and dead cells. AO is used in conjunction with EB dye (DNA-binding dye), which stains cells that have a permeable plasma membrane and have lost membrane integrity. AO/EB staining was carried out to analyze the MY3 treatment effect on the viability and morphology of HeLa and HepG2 cells. We observed untreated cells as fluorescent green under the microscope, indicating that they were viable, and cells treated with MY3 appeared bright orange with apoptotic bodies and condensed nuclei (Figs. 4 and 5).
| Figure 3. Percentage viability of HeLa, HepG2, Jurkat, CHO, and lymphocyte cells treated with different concentrations of MY3. *significant at p < 0.05 and **significant at p < 0.001, when compared to the control. |
| Table 1. IC50 values of MY3 on the viability of HeLa, HepG2, Jurkat, and CHO cell lines. |

| Figure 4. Photographs of HeLa cells as seen under the fluorescence microscope. (a) Control cells. (b) HeLa treated with MY3. The arrows indicate apoptotic cells. Apoptotic and dead cells are orange in color and viable cells are green in color. |
| Figure 5. Photographs of HepG2 cells as seen under the fluorescence microscope. (a) Control HepG2. (b) HepG2 treated with MY3. The arrow indicates apoptotic cells. Apoptotic and dead cells are orange in color and viable cells are green in color. |

DNA fragmentation analysis
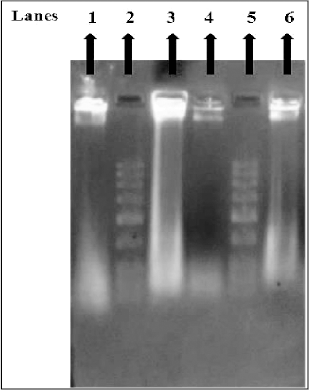
In apoptotic cells, the endonuclease-mediated cleavage of DNA leads to the formation of DNA fragments of 180–200 bp oligomers, which is the hallmark of apoptotic cell death. The DNA isolated from MY3-treated HeLa and HepG2 cells when analyzed by agarose gel (0.8%) electrophoresis, we observed a DNA smear in the gel. This is evidence for the ongoing apoptosis in the treated cells where fragmented or cleaved DNA was clearly visible. However, in the case of control cells, the DNA appeared as a single thick band indicative of cell viability with an intact DNA (Fig. 6).
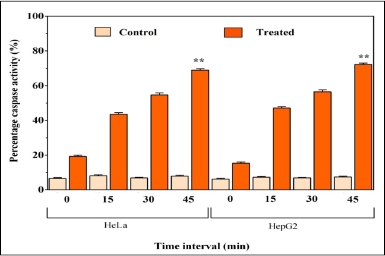
Caspase-3, 7, and 10 apoptosis assay
Caspases are enzymes belonging to the family of cysteine aspartic proteases which play crucial roles in apoptosis and Caspase-3 is the primary executioner of apoptosis. After 48 h of treatment with MY3, when HeLa and HepG2 cells were analyzed for their caspase activities, it was found that the initial activity was 19.2% in the HeLa cells which recorded an increase to 68.9% after 45 minutes (Fig. 7). In the HepG2 cells, the initial activity of 15.3% was increased to 72.3% after 45 minutes by MY3 treatment, while no changes were observed in inhibitor-treated cancer cells. A 2.5-fold increment of caspase-3, 7, and 10 activity in the case of HeLa cells and a 3.7-fold increment in the case of HepG2 cells were seen as a result of pigment MY3 treatment.
| Figure 6. DNA from HeLa and HepG2 cells as analyzed by agarose gel electrophoresis. Lanes: (1) DNA of untreated HeLa cells, (2) DNA ladder, (3) DNA extracted from MY3-treated HeLa cells, (4) DNA f untreated HepG2 cells, (5) DNA ladder, (6) DNA extracted from MY3-treated HepG2 cells. |
| Figure 7. Comparison of caspase-3, 7, and 10 activity of MY3-treated and untreated HeLa and HepG2 cells from 0 to 45 minutes. Each data point indicates the mean of three replicates and the vertical bars indicate SEM. **significant at p < 0.001. |
LDH activity assay
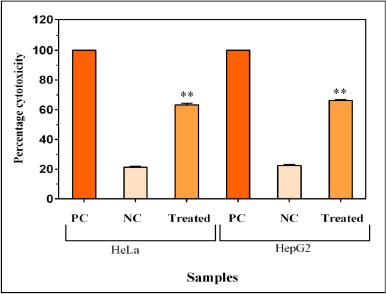
Cytotoxic compounds disrupt the integrity of the cell membrane and release LDH, a stable cytosolic enzyme. Hence, cytotoxicity can be evaluated by examining the release of LDH from the treated cells. When MY3 was treated on to HeLa and HepG2 cells for 48 hours, the cytotoxicity was 63.26% and 66.28%, respectively, as per the LDH release assay (Fig. 8). This indicates the direct cytotoxic effects of the pigment on the cervical and the liver cancer cell lines. The highest cytotoxic effect was exhibited by MY3 pigment on HepG2 cells. As a positive control for this experiment, 1% triton X100 treatment was used, which estimates the maximum LDH release with 100% cytotoxicity.
LC-MS analysis
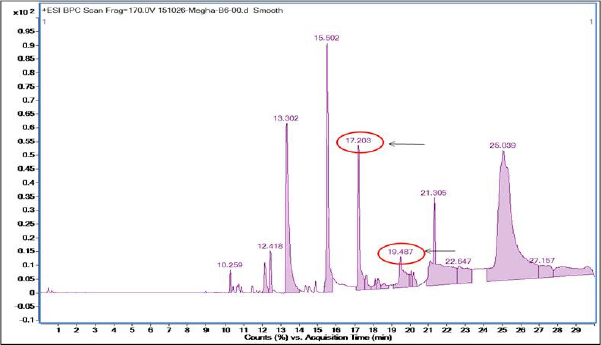
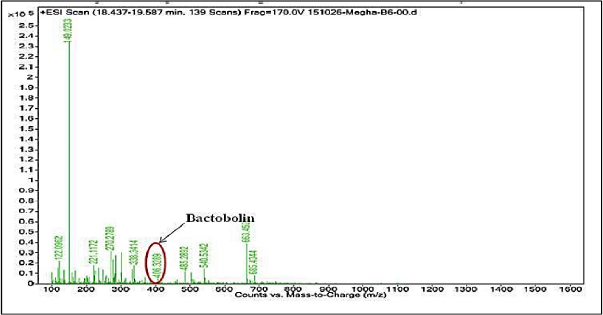
When MY3 was subjected to LC-MS analysis, eight peaks resulted with a larger peak at the RT of 15.5 minutes and others with RTs of 10.2, 12.4, 13.3, 17.2, 19.4, 21.3, and 25.03 minutes (Fig. 9). The MS analysis of the peaks at 13.3 or 17.2 minutes was not showing any molecular ion fragments of significant anticancer activities, while the third major peak with RT 19.4 minutes resulted in a fragment ion with m/z value of 406.32. Through library search and anticancer database search (http://data-analysis.charite.de/care/), this m/z value corresponds to the compound bactobolin with a molecular weight of 383.33 (Fig. 10). Through literature survey, it was found that the compound bactobolin was reported as an antitumor antibiotic produced by Pseudomonas BMG13-A7 (Kondo et al., 1979). But with regard to its report on the bacterial species M. terreus, this is the first report to the best of our knowledge. It can be assumed that the presence of this compound along with some other unidentified compounds might be the reason for the anticancer activity of MY3 from M. terreus.
| Figure 8. Cytotoxic effects of MY3 on HeLa and HepG2 cells as per the LDH assay. PC = Positive control (1% Triton-X 100), NC = Negative control. Each data point represents the mean of three replicates and the vertical bars indicate SEM. **p < 0.001 level of significance. |
DISCUSSION
A number of novel secondary metabolites and pigmented compounds with wide range of bioactivities against several diseases have been identified from microorgansims. They possess biological properties like anticancer, antimicrobial, antiproliferative, and antioxidant activities (Rao et al., 2017). There are many fungal and bacterial species isolated from soil, water, and marine sources having a wide variety of pigments, including prodigiosin, carotenoids, melanine, pyocyanine, and violacein having various applications (Malik et al., 2012). In order to find a natural, alternative therapeutic compound to treat cancer, the present work was aimed at evaluating the cytotoxic potential of bacterial pigments. In this pursuit, we isolated pigmented bacteria from different soil sources and were successful in collecting few pigmented colonies. A yellow colored bacteria among them demonstrated promising cytotoxicity to the cancer cell lines HeLa, HepG2, and Jurkat which was identified as M. terreus. The pigment extract from the isolate was partially purified by using the thin layer chromatography technique to identify the compound which exhibited cytotoxicity. The yellow pigment extract from M. terreus had resulted in a visible yellow band and was named as MY3. As the yellow fraction MY3 demonstrated promising inhibitory effects on the viability of all the tested cancer cell lines, this was chosen for further studies. To analyze the safety aspects on humans, this was checked on human peripheral lymphocytes (normal control) and also on a non-cancerous cell line, CHO. This yellow pigment MY3 had significant growth inhibitory effects on HeLa, HepG2, and Jurkat cells at very low concentrations with an IC50 value <15 µg/ml on all the cancer cell lines (10.24 µg/ml on HeLa, 12.4 µg/ml on HepG2, and 11.3 µg/ml on Jurkat). With respect to the normal cells (CHO and lymphocytes), MY3 treatment had not caused any cytotoxic effects on the tested concentrations. This property is of greater significance toward the development of a therapeutic agent, which is safe for normal cells, safety being a major concern in the field of cancer chemotherapy. This is the first report of a pigment from M. terreus having cytotoxic properties against cancer cell lines, although other species of Micrococcus have been reported to have anticancer activities. There was a report about the ethyl acetate extract of Micrococcus luteus possessing anticancer activity against cancer cell lines (Mithun and Rao, 2012). Furthermore, there is another report of a yellow pigment from M. luteus having cytotoxic effects against MCF-7 cell line (Ushasri and Shalomi, 2015). Rostomi et al. (2016) reported about a carotenoid pigment produced from Micrococcus roseus (PTCC 1411) showing antioxidant and anticancer properties. But there are no reports on M. terreus.
| Figure 9. HPLC of MY3 revealing peaks at 15.5, 17.2, and 19.48 minutes RTs. |
| Figure 10. Electrospray ionization mass spectrum of the peak with an RT of 19.4 minutes from MY3 showing the ion fragment with 406.32 as the m/z value that corresponds to the molecular weight of bactobolin. |
Further proof for the cytotoxic and anticancer potential of the pigment MY3 in the current study came from the results of fluorescence microscopical observations. The results demonstrated a drastic reduction in cell numbers of HeLa and HepG2, along with death of the treated cells, indicated by the presence of apoptotic bodies and cells fluorescing bright orange as opposed to the untreated control cells which were viable and fluorescing green. One of the major goals in cancer therapy involving external agents is inducing cell death via apoptosis and thereby inhibiting the growth of the cancer cells. The pigment MY3 in the present work was indeed triggering apoptosis in HeLa and HepG2 cells, as we could see a smear in the gel when the DNA from the treated cells was electrophoresed, thus confirming the presence of fragmented DNA. The DNA pattern on the gel gave clear evidence for cells undergoing apoptosis. Furthermore, the onset of apoptosis involves the activation of caspases (mainly caspase-3, 7, and 10) in cells as they are important mediators of apoptosis. When caspase-3, 7, and 10 activity was analyzed on HeLa and HepG2 cells treated with MY3, a 2.5-fold and a 3.7-fold increase was found when compared to that of the untreated cells, respectively.
Many of the naturally existing anticancer compounds bring down the cell proliferation by direct cytotoxicity which can be very well demonstrated by LDH activity assay. Here in the current study, the pigment MY3 was able to cause damage to the plasma membrane of the treated cancer cells, HeLa and HepG2. There was a higher level of LDH activity in HeLa and HepG2 cells treated with MY3, and the percentage cytotoxicity was 63.2% and 66.3%, respectively.
As the pigment MY3 is of therapeutic significance, it was found necessary to chemically characterize it. During characterization, liquid chromatography resulted in eight fractions eluting at different RTs. MS analysis of one of the eluents at RT 19.4 minutes resulted in an ionic fragment with a mass to charge ratio (m/z value) of 406.32, which corresponds to the compound bactobolin with a molecular weight of 383.33. In an earlier study, Kondo et al. (1979) reported antitumor activity of bactobolin extracted from Pseudomonas BMG13-A7 culture broth toward mouse leukemia cells. The presence of this compound, i.e., bactobolin in the pigment fraction MY3, might be responsible for its currently observed anticancer activity. Although this compound was reported earlier from other sources, this is the first report of its presence from M. terreus JGI 19.
CONCLUSION
The current study demonstrated that the pigment MY3 from M. terreus has strong cytotoxic and anti-proliferative properties toward HepG2, HeLa, and Jurkat cancer cell lines at very low concentrations and additionally is non-toxic toward normal human lymphocytes even at higher concentrations, which makes it an ideal candidate for future in-vivo and drug developmental studies.
ACKNOWLEDGMENTS
The support by DST-INSPIRE Fellowship (No.-DST/INSPIRE Fellowship/2011/213) is highly appreciated and acknowledged by author Ms. Megha Shukla. The authors also express their gratitude toward the JGI management for the facilities provided to carry out the research work.
AUTHOR CONTRIBUTIONS
All authors made substantial contributions to conception and design, acquisition of data, or analysis and interpretation of data; took part in drafting the article or revising it critically for important intellectual content; agreed to submit to the current journal; gave final approval of the version to be published; and agree to be accountable for all aspects of the work. All the authors are eligible to be an author as per the international committee of medical journal editors (ICMJE) requirements/guidelines.
CONFLICTS OF INTEREST
The authors report no financial or any other conflicts of interest in this work.
ETHICAL APPROVALS
This study does not involve experiments on animals or human subjects.
PUBLISHER’S NOTE
This journal remains neutral with regard to jurisdictional claims in published institutional affiliation.
REFERENCES
Aneja KR. Cultivation techniques for isolation and enumeration of microorganisms. In: Experiments in microbiology, plant pathology and biotechnology. 4th edition, New Age International Publishers, New Delhi, India, pp 154–88, 2003.
Cragg GM, Grothaus PG, Newman DJ. Impact of natural products on developing new anti-cancer agents. Chem Rev, 2009; 109:3012–43. CrossRef
Diaz-Ruiz C, Montaner B, Perez-Tomas R. Prodigiosin induces cell death and morphological changes indicative of apoptosis in gastric cancer cell line HGT-1. Histol Histopathol, 2001; 16(2):415–21.
Indian Council of Medical Research. Ethical guidelines for biomedical research on human participants. Indian Council of Medical Research, New Delhi, India, 2006.
Kirchner JG, Miller JM, Keller GJ. Separation and identification of some terpenes by new chromatographic technique. Anal Chem, 1951; 23(3):420–5. CrossRef
Kondo S, Horiuchi Y, Hamada M, Takeuchi T, Umezawa H. A new antitumor antibiotic, bactobolin produced by Pseudomonas. J Antibiot, 1979; 32(10):1069–71. CrossRef
Malik K, Tokkas J, Goyal S. Microbial pigments: a review. Int J Microb Resour Technol, 2012; 1(4):361–5.
Mithun VSL, Rao CSV. Isolation and molecular characterization of anti-cancerous compound producing marine bacteria by using 16S rRNA sequencing and GC-MS techniques. Int J Mod Eng Res, 2012; 2(6):4510–5.
Mosmann T. Rapid colorimetric assay for cellular growth and survival: application to proliferation and cytotoxic assays. J Immunol Methods, 1983; 65(1–2):55–63. CrossRef
Nadumane VK, Venkat P, Pal A, Dharod H, Shukla M, Prashanthi K. A novel metabolite from Aspergillus ochraceus JGI 25 showing cytotoxicity to HeLa cells. Indian J Pharm Sci, 2013; 75(5):507.
Rao MPN, Xiao M, Li WJ. Fungal and bacterial pigments: secondary metabolites with wide applications. Front Microbiol, 2017; 8:1–13. CrossRef
Rostomi H, Hamedi H, Yolmeh M. Some biological activities of pigments extracted from Micrococcus roseus (PTCC 1411) and Rhodotorulaglutinis (PTCC 5257). Int J Immunopathol Pharmacol, 2016; 29(4):684–95. CrossRef
Sambrook J, Russell DW. Molecular cloning. A laboratory manual. 3rd edition, Cold Spring Harbor Laboratory Press, Cold Spring Harbor, NY, 2001.
Soliev AB, Hosokawa K, Enomoto K. Bioactive pigments from marine bacteria: application and physiological roles. Evid Based Complement Altern Med, 2011; 2011:1–17. CrossRef
Ushasri R, Shalomi CGW. A study on in vitro anti breast cancer activity of crude ethanol and acetone pigment extracts of Micrococcus luteus by MTT assay and analysis of pigment by thin layer chromatography. Int J Pharm Biol Sci, 2015; 5(1):59–65.