
INTRODUCTION
Sonidegib is used to treat advanced basal cell carcinoma in adult patients who have persisted post-surgery or radiation therapy. Many human cancers are due to hedgehog (Hh) pathway, but Sonidegib efficiently obstructs the controller called smoothened (SMO), inhibiting the hedgehog pathway from functioning. As a consequence, cancers that depend on the hedgehog path are incapable of growth (Einolf et al., 2017; Fendrich et al., 2011; Pan et al., 2010). The drug prevents the transmembrane protein called SMO which plays a significant role in Hh signal transduction. This results in the prevention of Hh signaling and anti-tumor activity in several animal models. Sonidegib is chemically designated as N-[6-[(2S,6R)-2,6-dimethylmorpholin-4-yl]pyridin-3-yl]-2-methyl-3[4(trifluoromethoxy)phenyl] benzamide with a molecular formula of C26H26F3N3O3 and a molecular weight of 485.498 g/mol (Fig. 1) (Burness, 2015). Sonidegib shows low absorption, which is widely distributed and is slowly metabolized. The study of the absorbed drug was ensued largely by hydrolytic and oxidative metabolism (Zollinger et al., 2014). The hedgehog pathway action (as estimated by glioma-associated oncogene-1 expression) was noted at baseline in men with localized high-risk prostate cancer. Sonidegib penetrates into the prostatic tissue and induces a >60-fold suppression of the hedgehog pathway (Ross et al., 2017). A study was reported on exposure response study of the drug (lde 225), an oral inhibitor of the hedgehog signaling path, for effectiveness and safety in patients with advanced solid tumors (Zhou et al., 2016).
 | Figure 1. Sonidegib’s structure. [Click here to view] |
The literature on the drug revealed that no LC–MS/MS approaches were described for the pharmacokinetic study of Sonidegib (Saili et al., 2018; Zollinger et al., 2014) in healthy rabbits. An high performance liquid chromatography (HPLC) method was reported in the patent (Fredenhagen et al., 2013) utilizing Waters’ Symmetry C18 (3.5 μ particle, 4.6 × 150 mm) column with a gradient program. In short, the aim of the study was not only to develop but also validate such HPLC methods which have the qualities of simple to composition mobile phase and rapid sample preparation. Different applications of the studied methods are in therapeutic drug monitoring, pharmacodynamics, and pharmacokinetic studies. The calculation and interpretation of different dosage forms of sonidegib and their in vivo activity in humans will also be benefited from the described method.
MATERIALS AND METHODS
Chemical and reagent materials
Sonidegib and gliquidone (reference materials) were acquired from MSN Laboratories, Telangana, India. Phenomenex-C18 (50 × 4 mm) 5-μm columns were bought from Thermo-Fischer Pvt. Ltd, Hyderabad, India. HPLC-grade acetonitrile, methanol, and formic acid of an analytical grade were bought from SD Fine Chemicals, Chennai, India. The animal studies on rabbits were carried out at Vijaya College of Pharmacy, Hyderabad, approved by the Institutional Ethical Committee with reference no-1292/ac/09/CPCSEA/17-41/A on 8 March 2019.
Instrument
The LC–MS/MS instrument consists of a Shimadzu LCS10 chromatographic equipment combined with an MS/MS API 3,000 from Applied Biosystems Sciex, Canada, furnished with a turbo ion spray source for ionic induction. Chromatographic data were integrated and supervised by the software belonging to the Analyst version1.4.10 of Applied Biosystems.
Liquid chromatography
Sonidegib and the internal standard (IS) (gliquidone) were separated by infusing the solution of the sample into C18 Phenomenex column (50 × 4 mm, 5 μ) utilizing a movable phase combination of ACN, CH3OH, and 0.10% HCOOH in the proportion of 60:25:15 by volume. Degasification of the movable phase was executed by the process of filtration through 0.50 μ membrane filter, followed by sonication. Drug and IS separation was achieved with the isocratic system by infusing the movable phase through stationary phase at 0.70 ml/minutes flow. The autosampler and column temperatures were monitored at 5.0°C and 30.0°C, respectively.
Mass scanning optimization
Sonidegib stock solution was processed by solubilizing the drug in HPLC-grade CH3OH. Serial dilutions were prepared with the solvent mixture of CH3OH and water in the combination of 80:20 v/v. The mass system was run in the positive ionization mode and the constituents were assessed by multiple reactions monitoring (MRM) of the transition pairs of transitions: m/z 486.2/191.1 and m/z 528.5/403.4 for Sonidegib and gliquidone, respectively.
Mass spectrometry
The source temperature was set to 500°C and curtain gas of N2 was adjusted to a constant reading of 11.0 units. The heater at the electrospray interface was turned on and ion spray voltage was set to 4,500 V for ionization. Mass conditions were set accordingly to attain more sensitive unit resolutions. The MRM mode for sonidegib and gliquidone was noted at m/z 486.2/191.1 and m/z 528.5/403.4, respectively.
Preparation of calibration and quality control standards
Sonidegib stock solution was processed in 80% CH3OH to get the concentration of 1 mg/ml. Calibration standards were prepared in the concentration levels of 103.0, 154.0, 240.0, 400.2, 660.0, 950.0, 1,236.0, and 1,545.0 ng/ml; these solutions were processed from sonidegib stock solution with 80% methanol. High, medium, and low quality control (HQC, MQC and LQC) lower limit of quantification (LLOQ) standards for sonidegib were (1,545.00, 1,030.00, 288.40, and 103.00 ng/ml) executed in the similar manner. The IS stock solution (1 mg/ml) was also processed with 80% CH3OH, and further 50 ng/ml was processed by dilution method. All the prepared solutions were reserved at 2.0°C–8.0°C till the samples were analyzed (Dadhaniya et al., 2013; Nageswara Rao et al., 2008; Rezk et al., 2016).
Sample preparation
To 400 μl of plasma, 100 μl of IS were mixed and to the sample 400 μl CH3OH was mixed and centrifugation was processed at 3,000 rpm for 15.0–20.0 minutes at 5.0°C. The organic portion was dried in a lyophilizer, and to the residue, 250 μl of the mobile phase was added and the required amount of samples was labeled and transferred into autosampler vials, and injected into the chromatographic system (Chandrasekar et al., 2009; Kumar et al., 2014; Neelima et al., 2014).
Pharmacokinetic study
Six male rabbits of about 2.5–3 kg were elected for the pharmacokinetic study of sonidegib. Before 12 hours of drug administration into the rabbits, food was evaded. Water was given for the rabbits for the entire study and the drug dose of 25 mg/kg was given to the rabbits and 0.60 ml of blood samples were collected from the marginal ear vein of rabbits before dosing (zero times) and at the time intervals of 0.5, 1.0, 1.5, 2.0, 2.5, 3.0, 4.0, 5.0, 6.0, 8.0, 12.0, 16.0, 24.0, 36.0, and 48.0 hours. The resultant solution was exposed to 4,500 rpm in the centrifuge for 15.0 minutes and separated plasma was relocated into labeled polypropylene tubes at −20.0°C (Chambers et al., 2014; Patel et al., 2011; Wozniakiewicz et al., 2014).
Validation of the analytical method
Validation of the method was carried out according to FDA guidelines on bioanalytical method validation (ICH, 1995, 1996; USFDA, 2001).
Calibration curve
For the assessment of linearity, linear plots of eight non-zero standards were utilized. Eight non-zero points of 103, 154, 240, 400, 660, 950, 1,236, and 1,545 ng/ml were analyzed. The findings from three precision and accuracy sets were taken into consideration to estimate the goodness of fit utilizing 1/x and 1/x2 weighing factors (Chandrasekar et al., 2009; USFDA, 2001). Deviancy from theoretical concentration should be ±20% for the LLOQ level and ±15% for other quality control samples. Regression coefficient (r2) should be ≥0.98.
Specificity and selectivity
The interference between drug and matrix components was estimated by the study of six blank lots from six different sources. Two blanks and one LLOQ level were prepared, injected, and analyzed from each lot to estimate possible interference between IS and sonidegib. One blank spiked with the drug at the upper limit of quantification‑ and IS were injected into the LC system and the chromatograms were analyzed. Peak responses of constituents coeluting along with the drug should be <20.0% of the LLOQ level peak response. Peak responses of coeluents of IS should be less than 5.0% of the average IS peak response. The estimated concentrations of LLOQ level standard should be less than 20.0% from the theoretical concentrations (European Medicines Agency, 2011).
Accuracy and precision
These parameters were assessed by analyzing five similar QC samples of sonidegib at LLOQ, HQC, MQC, and LQC concentration levels in three analytical runs. Interassay accuracy was analyzed as the relative variance between the mean calculated concentrations after three runs and the theoretical concentration (Fernandez et al., 2012; Patel et al., 2011). Accuracy should be ±20.0% for the LLOQ and ±15.0% for the remaining concentrations. Inter and intraassay precision results were signified by the percentage of coefficient of variation (%CV), which should be <20.0% for the LLOQ level and <15.0% for the other QC samples.
Matrix factor
To assess the matrix factor, plasma was processed at LQC and HQC concentration levels after extracting six dissimilar blank matrix lots (Chambers et al., 2014). Simultaneously, six replicas of equivalent neat QC samples were prepared and analyzed. It was calculated with the following formula:
Matrix Factor = (Peak area in presence of matrix components / Average peak area in aqueous samples).
Recovery
The method recovery was assessed by linking the average peak responses of the six extracted HQC, MQC, and LQC samples (1,545.0, 1,030.0, and 288.4 ng/ml, respectively) to mean peak response of six spiked concentrations with the similar amounts of HQC, MQC, and LQC samples.
Autosampler stability
This constraint was evaluated by executing six QC samples (LQC and HQC) which were kept in an autosampler. These standard samples were infused after 24.0 hours and were evaluated against freshly processed calibration controls. The resultant findings when equated with theoretical concentrations should be in the ±15.0%.
Stability
LQC and HQC frozen samples were collected from the freezer after three freeze–thaw cycles. Samples were kept at −30.0°C in three cycles of 24.0, 48.0, and 72.0 hours. For the long-term stability of the drug, QC samples were also assessed by analysis after 4 months of storage at −25.0°C and −70.0°C. Benchtop stability was evaluated for a 7-hours period with standard concentrations. Stability samples were processed and separated along with fresh calibration standard samples. The precision and accuracy of the stability solutions should be ±15.0% of their original concentrations.
Dilution integrity
The concentration of the drug above the ULOQ level was processed and precision and accuracy results were assessed. The percentage of nominal concentration should be ±15.0%.
RESULTS AND DISCUSSION
Method development and its validation
A technique for sample separation was executed for extracting the drug and IS from the plasma solutions. LC constraints were enhanced through variable trials to get improved resolution and to increase the S/N (signal to noise) proportion of drug and IS. Mass constraints were supervised by infusing the sample directly into the electro-spray ionizing source of the mass equipment.
The acetonitrile percentage was amplified to develop an accurate and specific technique after the MRM transitions were finalized. A better resolution and separation were obtained utilizing an isocratic movable phase of ACN, CH3OH, and 0.10% HCOOH (60:25:15 v/v) at 0.70 ml/minutes flow rate.
Selectivity
Six variable batches of blank plasma samples were opted and the nosiness of interfering constituents at retaining time of analyte and IS were evaluated. The nosiness of the matrix components were not identified at the retaining time and m/z of sonidegib and IS in all batches elected (Figs. 2 and 3), simplifies the chromatograms for blank, LLOQ, and blank with IS injections. The interfering peak response should be less than 20% from the LLOQ’s peak response.
Linearity
Calibration plot was made in the concentration range of 103−1,545 ng/ml in plasma with a correlation coefficient [r2] of 0.998. Three linearity plots were linear in employed concentration range with an eight-point calibration utilized for the quantitation by linear regression. The linear curve regression equation was found to be y = 0.9976x + 1.6425. The precision (%CV) detected for the linear curve was found to be ≤4.93 for sonidegib and the findings are shown in Table 1. The r2 value should be more than 0.99.
 | Figure 2. Typical chromatograms of (A) blank plasma (B) spiked with LLOQ and IS. [Click here to view] |
 | Figure 3. Sonidegib’s chromatograms of (A) LQC, (B) MQC, and (C) HQC samples. [Click here to view] |
Accuracy and precision
The method’s accuracy and precision were evaluated by assessing interday and intraday lot deviancies of three QC standard solutions in six duplicates: 288.4, 1,030, and 1,545 ng/ml, as shown in Table 2. Intraday accuracy and precision were within 1.54%−7.18% and 98.56%−102.80%, respectively. Interday accuracy and precision were within 1.82%−6.25% and 97.62%−102.76%, respectively. These findings direct that the technique was reliable, specific, reproducible, and accurate. The %CV values were determined for the control standards at different days and the results should be ±15%.
Matrix factor (MF)
The MF was calculated in percentage coefficient of variance and the findings for LQC and HQC levels were 1.46% and 0.28%, respectively. The calculated findings were within the acceptable limit of ±15.0%. The calculated values are shown in Table 3.
Dilution integrity
Sonidegib was diluted up to 20-fold by blank plasma and was examined with spiked samples above the upper limit of the calibration standard and samples with the highest concentration. The percentage of original concentration was within ±15.0 and the detected precision was within ≤15.0%. This proves that the analyte solution can be diluted up to 20 times and yet the findings can be detected.
Stability studies
Sonidegib stability data, which includes autosampler, freeze–thaw, long-term, and benchtop, were within the acceptable limit. The findings are tabulated in Table 4.
Recovery
The recovery percentages were analyzed by assessing the exact peak area of the drug and IS from the processed plasma samples as per the developed technique. The degree of recovery of sonidegib and of IS should be constant, reproducible, and precise. The overall average recovery of drug and IS was found to be 97.26% and 98.01%, respectively.
 | Table 1. Concentration of spiked plasma and RSD (%) for sonidegib. [Click here to view] |
 | Table 2. Sonidegib intraday and interday precision and accuracy. [Click here to view] |
 | Table 3. Sonidegib results for matrix effect. [Click here to view] |
 | Table 4. Stability data for sonidegib. [Click here to view] |
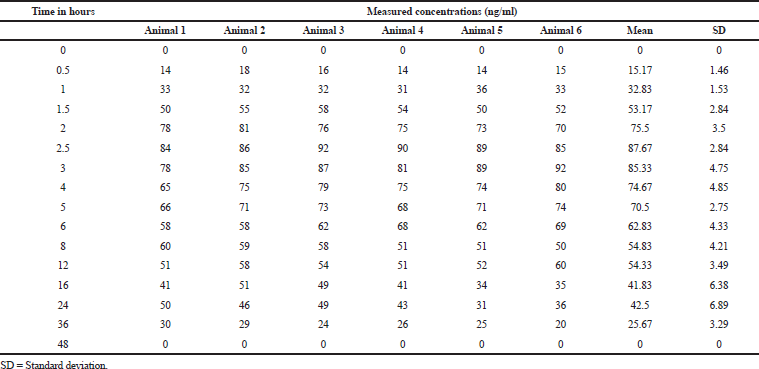 | Table 5. Plasma concentrations at different time intervals. [Click here to view] |
 | Table 6. Test animals (rabbits) PK parameters mean values. [Click here to view] |
Pharmacokinetics
The pharmacokinetic parameter of sonidegib was calculated from the graph obtained by taking plasma concentrations on Y-axis and time on X-axis using PK-Solver software. In this study, the trapezoidal rule was opted for measuring of an area under the curve from 0.0 to 48.0 hours (AUC0-48). Sonidegib has a mean Tmax of 3.833; and mean Cmax, AUC0Í¢ t, and AUC0Í¢ α for the test dosage form was 677.667, 6,306, and 6,471, respectively. In the reported method on blood, the Tmax, Cmax, and AUClast were 154 ± 32.6 ng/ml, 2–4 hours, and 8,680 ± 2,510 h.ng/ml, respectively (Fredenhagen et al., 2013). The resultant values are presented in Tables 5 and 6 and Fig 4.
 | Figure 4. Plasma concentration time profile curves of six rabbits. [Click here to view] |
CONCLUSION
In the present article, an LC–ESI–MS/MS procedure for the quantitation of sonidegib in plasma was efficiently established and validated. Chromatographic elution was achieved on Phenomenex-C18 (50 × 4 mm) 5 μ stationary phase with ACN, CH3OH, and 0.1% formic acid (60:25:15 by volume) as the movable phase monitored at a 0.70 ml/minutes flow. All the validation parameters, precision, selectivity, matrix effect, accuracy, dilution integrity, stability, and recovery, were within the acceptable limit. This technique was successfully executed to study pharmacokinetic parameters in six male rabbits and the drug has shown average Tmax of 3.833; mean Cmax, AUC0→t and AUC0→α for the sample dosage form was 677.667, 6,306, and 6,471, respectively, in the pharmacokinetic study on healthy rabbits. The applicability of the technique advises its further application for drug interaction, bioavailability, and bioequivalence studies.
AUTHOR CONTRIBUTIONS
All authors made substantial contributions to conception and design, acquisition of data, or analysis and interpretation of data; took part in drafting the article or revising it critically for important intellectual content; agreed to submit to the current journal; gave final approval of the version to be published; and agree to be accountable for all aspects of the work. All the authors are eligible to be an author as per the international committee of medical journal editors (ICMJE) requirements/guidelines.
FUNDING
There is no funding to report.
CONFLICTS OF INTEREST
The authors report no financial or any other conflicts of interest in this work.
ETHICAL APPROVALS
Research protocol was approved by the Institutional Ethical Committee with reference no-1292/ac/09/CPCSEA/17-41/A on 8 March 2019. .
PUBLISHER’S NOTE
This journal remains neutral with regard to jurisdictional claims in published institutional affiliation.
REFERENCES
Burness CB. Sonidegib: first global approval. Drugs, 2015; 75(13):1559–66. CrossRef
Chambers EE, Woodcock MJ, Wheaton JP. Systematic development of an UPLC–MS/MS method for the determination of tricyclic antidepressants inhumanurine. J Pharm Biomed Anal, 2014; 88:660–5. CrossRef
Chandrasekar MJN, Chandrasekar AR, Krishnaraj K, Muralidharan S, Rajan S, Suresh B. Liquid chromatography-mass spectrometry determination of cetrizine hydrochloridein rabbit plasma. Asian J Chem, 2009; 21(8):5821–8.
Dadhaniya T, Chaudhary K, Mehta P. Developmentof LC-MS/MS method for determination of iloperidone in rabbit plasma: application to a pharmacokinetic study. Int J Pharm Pharm Sci, 2013; 7(4):294–7.
Einolf HJ, Zhou J, Won C, Wang L, Rebello S. A physiologically-based pharmacokinetic modeling approach to predict drug–drug interactions of sonidegib (LDE225) with perpetrators of CYP3A in cancer patients. Drug Metab Dispos, 2017; 45:361–74. CrossRef
European Medicines Agency. Guidelineon bioanalytical method validation. European Medicines Agency, Amsterdam, Netherlands, 2011.
Fendrich V, Wiese D, Waldmann J, Lauth M, Heverhagen AE, Rehm J, Bartsch DK. Hedgehog inhibition with the orally bioavailable Smo antagonist LDE225 represses tumor growth and prolongs survival in a transgenic mouse model of islet cell neoplasms. Ann Surg, 2011; 254(5):818–23. CrossRef
Fernandez MMR, Wille SMR, Samyn N. Quantitative method validation for the analysis of 27 antidepressants and metabolites in plasma with ultra performance liquid chromatography–tandem mass spectrometry. Ther Drug Monit, 2012; 34:11–24. CrossRef
ICH. International Conferenceon Harmonization (ICH) of technical requirements for the registration of pharmaceuticals for human use, validation of analytical procedures: methodologyICH-Q2B. ICH, Geneva, Switzerland, 1996.
ICH. Validation of analytical procedures: methodology. ICH Harmonised Tripartite Guidelines, London, UK, 1995.
Kumar Moola S, BalaSekhara Reddy Challa, Chandrasekhar KB. Bioanalytical methoddevelopment andvalidation ofeszopiclone inrabbit plasmaby HPLC-MS/MS andits applicationto pharmacokineticstudy. Int J Biol Pharm Res, 2014; 5(9):719–27.
Nageswara Rao R, Shinde DD, Talluri MV, Agawane SB. LC–ESI-MS determinationand pharmacokineticsof adrafinilin rats. J Chromatogr B Analyt Technol Biomed Life Sci, 2008; 873:119–23. CrossRef
Neelima P, Chandanam S, SreenivasRao T, Verareddy S. Developmentand validation of liquidchromatography- tandemmas spectrometry for determinationof olanzapine in rabbit plasma. DHR Int J Pharm Sci, 2014; 5(1);151–9.
Pan S, Wu X, Jiang J, Gao W, Wan Y, Cheng D, Han D, Liu J, Englund NP, Wang Y, Peukert S, Miller-Moslin K, Yuan J, Guo R, Matsumoto M, Vattay A, Jiang Y, Tsao J, Sun F, Pferdekamper AC, Dodd S, Tuntland T, Maniara W, Kelleher JF, Yao Y, Warmuth M, Williams J, Dorsch M. Discovery of NVP-LDE225, a potent and selective smoothened antagonist. ACS Med Chem Lett, 2010; 1(3):130–4. CrossRef
Patel DS, Sharma N, Patel MC. Developmentand validationof aselective andsensitive LC–MS/MS methodfor determinationof cycloserinein humanplasma: application to bioequivalence study. J Chromatogr B, 2011: 879:2265–73. CrossRef
Rezk MR, Basalious EB, Amin ME. Noveland sensitiveUPLC- MS/MSmethod for quantificationof sofobuvirin humanplasma: applicationto abioequivalencestudy. Biomed Chromatogr, 2016; 30:1354–62. CrossRef
Ross AE, Hughes RM, Glavaris S, Ghabili K, He P, Anders NM, Harb R, Tosoian JJ, Marchionni L, Schaeffer EM, Partin AW, Allaf ME, Bivalacqua TJ, Chapman C, O’Neal T, DeMarzo AM, Hurley PJ, Rudek MA, Antonarakis ES. Pharmacodynamic and pharmacokinetic neoadjuvant study of hedgehog pathway inhibitor Sonidegib (LDE-225) in menwith high-risklocalized prostatecancer undergoing prostatectomy. Oncotarget, 2017; 8(61):104182–92. CrossRef
Saili XIE, Xiaoxia HU, Lei YE. Studyon the pharmacokinetics of sonidegib in rats. Lat Am J Pharm, 2018; 37(10):1933–7.
USFDA. Guidance for industry bioanalytical method validation, Food and drug administration, center for drug evaluation and research (CDER). USFDA, Rockville, MD, 2001.
Wozniakiewicz M, Wietecha-PosÅ‚uszny R, Moos A. Development of micro extraction by packed sorbent for toxicological analysis of tricyclic antidepressant drugs in human oral fluid. J Chromatogr A, 2014; 1337:9–16. CrossRef
Zhou J, Quinlan M, Hurh E, Sellami D. Exposure-response analysisof sonidegib(lde225), anoral inhibitor ofthe hedgehog signalingpathway, for effectiveness andsafety in patientswith advancedsolid tumors. J Clin Pharmacol, 2016; 56(11):1406–15. CrossRef
Zollinger M, Lozach F, Hurh E, Emotte C, Bauly H, Swart P. Absorption,distribution, metabolismandexcretion (ADME) ofC-14-sonidegib(LDE225) inhealthyvolunteers. Cancer Chemother Pharmacol, 2014; 74(1):63–75. https://patents.google.com/patent/WO2015092720A1/en (Accessed 05 September 2020) https://www.selleckchem.com/products/LDE225(NVP-LDE225).html (Accessed 05 September 2020) CrossRef