
INTRODUCTION
Norethindrone is synthetic progesterone (progestin) that belongs to 19-nortestosterone derivatives family (Schindler et al., 2003). Scheme 1 below shows the chemical structure of norethindrone.
Norethindrone can be used in combination with some oral contraceptive pills or progestin-only pills. Also, it is useful for the treatment of certain illnesses and diseases such as premenstrual syndrome, irregular or painful periods, abnormal heavy bleeding, menopausal syndrome (with estrogen), or to postpone a period. It is also generally used to help in the prevention of uterine hemorrhage in complicated non-surgical or pre-surgical gynecologic cases and in treating nonresponsive cyclical mastalgia (Santos et al., 2014).
The half-life of the drug is around 10 hours and it is administered once daily. The authors prepared an oral sustained release/controlled release nanoparticulate liquid medicated formulation (LMF) in an effort to extend the release of the drug, improve patient convenience, and hence compliance. The drug was solubilized using hydroxypropyl-beta-cyclodextrin (HP-β-CD) and polyvinyl pyrrolidone (PVP) polymer. Then the solubilized drug was complexed with low molecular weight chitosan (LMWC). The polyelectrolyte complex was homogenized with oleic acid and tween 80 to prepare the nanoemulsion (Altaani et al., 2019). Thus a need for a simple, accurate, and sensitive method to measure the drug in the dissolution media emerged.
There are several methods for the assay of norethindrone in pharmaceutical formulations containing the drug alone or with estrogens like ethinyl estradiol. The first method was a rapid stability-indicating high-performance liquid chromatographic (HPLC) method coupled with a diode array detector for determination of the drug in plasma, tablets, and in a mixture of other steroids. It used an isocratic binary mobile phase (Hashem et al., 2015). The second method used a combination of second-order derivative spectrophotometric method and absorbance correction method (Ajitha et al., 2016). The third method is a reversed phase HPLC (RP-HPLC) method coupled with an ultraviolet-visible (UV-Vis) detector. The method was validated as per International Conference on Harmonization (ICH) guidelines in the concentration range 5–1,000 μg/ml and was found suitable for routine analysis of norethindrone and ethinyl estradiol in a mixture and formulation (Ajitha et al., 2015). A gradient RP-HPLC method was developed and validated for the determination of norethindrone and its impurities in tablets. The tablets were subjected to hydrolytic and oxidative, alkali, peroxide, thermal, humidity, and photolytic degradation studies and the purity of norethindrone acetate, ethinyl estradiol, and known impurity peaks were checked at every stage of the degradation studies (Krishna et al., 2011).
 | Scheme 1. Chemical structure of norethindrone (https://www.drugs.com/pro/norethindrone-tablets.html, 2017). [Click here to view] |
A method for determination of six estrogens and four progestogens, including norethindrone in several types of water bodies was developed and validated to assess human exposure to these pollutants. The procedure included solid-phase extraction of water and subsequent analysis of the extract by LC with diode array detection and mass spectrometric detection in series. The method was highly selective for the analysis (Lo'pez de Alda and Barcelo, 2000).
Other methods were developed for studying dissolution of the drug again from formulations containing norethindrone alone or with estrogens (ethinyl estradiol or mestranol) from tablets. The first method used UV-Vis spectroscopy (Bansal et al., 2011b) while the second method used the spectrofluorometric procedure (Hirai et al., 1980). Both of these methods needed validation as per ICH guidelines to demonstrate ruggedness and reproducibility. The last method used direct injections of the dissolution medium onto a RP column and monitoring the eluent serially with UV and fluorescence detectors (Goeh et al., 1982).
It is clear from the literature review that the available methods were developed for the determination of the drug and its impurities in pharmaceutical formulations and water bodies or for indicating the stability. Only two methods were developed for studying the dissolution of the drug from formulations. These two methods were complicated and needed validation. The purpose of this work was to develop and validate a novel HPLC method coupled with UV-Vis detection for the determination of norethindrone in different dissolution media. The dissolution media simulated the fed and fasted state since the nanoparticulate LMF was a sustained release/controlled release formulation. The method was simple in many terms. Neither derivatization nor extraction was needed for sample preparation. Isocratic single mobile phase rather than gradient flow was used. There was no need for coupling two or more detectors and only one UV-Vis detector was used. The linearity of the method was proved in a lower range (0.05–5 μg/ml) compared to other methods. The developed method was successfully used in studying the in vitro release of norethindrone from the prepared sustained release/controlled release nanoparticulate LMF (nanoemulsion) into 0.1 N HCl with 0.09% sodium lauryl sulfate (SLS) and into 0.05 M phosphate buffer pH 6.8 with 0.09% SLS.
MATERIALS AND METHODS
Materials
19-Norethindrone (batch no. MKBR5462V), (2-hydroxypropyl)-β-cyclodextrin (HP-β-CD) (batch no. BCBR0506V), and PVP K30 (batch no. 030M1471) were supplied by Sigma-Aldrich, USA. Anhydrous dichloromethane (batch no. B00K2589) was supplied by Acros Organic. High molecular weight chitosan (HMWC), 600–800 kDa (batch no. 9012-76-4) was supplied by Shanghai Hanshare Industry CO., China. Sodium hydroxide (batch no.20130618) and sodium dihydrogen phosphate dihydrate (batch no. 20121129) were supplied by Fisher Scientific, UK. Di-sodium hydrogen phosphate dihydrate (batch no. 67970) was supplied by Scharlau Chem., Spain. SLS (batch no. 0007838415) and acetic acid (batch no. SP151202) were supplied by AZ Chem., Germany. Absolute ethanol (batch no. 6022823) was supplied by Solvochem, Holland. 37% w/w HCl (batch no. 1016201) was supplied by Biosolvo, France. HPLC grade acetonitrile (batch no. 6308FS11) was supplied by Anhui Fulltime Specialized Solvents and Reagents Co., China. HPLC grade cyclohexane was supplied by Lab-Scan Analytical Science, Ireland. 0.45 μm Sartolon Polyamide cellulose membrane filters (batch no. 1554423) were supplied by Sartorius Stedim Biotech, Germany. Deionized water was prepared in the laboratories of Jordan University of Science and Technology and used throughout the study.
LMWC was prepared by acid hydrolysis reaction of HMWC.
Norethindrone method of analysis by RP-HPLC in dissolution media
Liquid chromatographic conditions
The analysis of norethindrone was carried out using a Merck-Hitachi La Chrom HPLC system, USA. It consisted of a UV-Vis detector (L-7455), an autosampler (L-7200), an elution pump (L-7150), and a degasser (L-7612).
The chromatographic separation was performed at room temperature on Thermo Scientific C18 (250 mm × 4.6 mm ID, 5 μm pore size) column. The mobile phase consisted of deionized water: acetonitrile (50:50, v/v) and 5 ml/l acetic acid. The mobile phase was filtered through a 0.45 μm regenerated cellulose membrane filter and the flow rate was 1.3 ml/minute. The injection volume was 20 μl and the drug was detected at 245 nm.
Preparation of calibration standards
Initially, a stock solution of norethindrone in ethanol: deionized water (30:70, v/v) (100 μg/ml) was prepared. After that, seven standard solutions were prepared by appropriate dilution of the stock solution with deionized water. The concentrations of the standard solutions were 0.05, 0.1, 0.25, 0.5, 1, 2, and 5 μg/ml.
Validation of the RP-HPLC method of analysis
The RP-HPLC method of analysis of norethindrone was validated in terms of linearity, accuracy and precision, specificity, limit of detection (LOD), limit of quantification (LOQ) or known as lower limit of quantitation (LLOQ), and degradation studies according to the ICH Guidelines (ICH, 2005; www.biopharminternational.com, 2016).
Linearity
The linearity was evaluated by injecting the seven prepared standard solutions and plotting peak areas as a function of norethindrone concentration. Six calibration curves were prepared on different days. The correlation coefficient (R), y-intercept, and the slope of the regression line were reported. The results were analyzed by one-way analysis of variance (ANOVA) test at a significance level of α = 0.05 (95% of confidence interval) using JMP statistical analysis software. Residue analysis was made for evaluation of the homoscedasticity.
Accuracy and precision
The accuracy and precision were evaluated by using quality control (QC) samples of norethindrone at three concentration levels (QC Low, QC Mid, and QC High). The samples were prepared by appropriate dilutions from the stock solution. The QC samples were injected into the HPLC system on three consecutive days. The results were analyzed by one-way ANOVA test at a significance level of α = 0.05 (95% of confidence interval) using JMP statistical analysis software.
Limit of detection and limit of quantitation
For the LOD and LOQ determination, Eqs. (1) and (2) were used, respectively.
where σ is the standard deviation of the response and s is the slope of the calibration curve.
Specificity
Specificity was evaluated to ensure that the peaks of the excipients used in the preparation of the nanoparticulate LMF (LMWC, HP-β-CD, and PVP K30) were resolved from the peak of the drug. Samples were spiked with the appropriate levels of these excipients and injected to demonstrate that the assay of the drug was not affected by their presence.
Degradation studies
Degradation studies were conducted at stress conditions (acidic and basic) according to the method described by Venkateswarlu et al. (2017). For the acidic degradation study: 3.5 mg of norethindrone was weighted and transferred to 20 ml volumetric flask, dissolved in 10 ml of acetonitrile, and sonicated for about 15 minutes. Then 1 ml of 5 N HCl was added and the solution was heated to 60°C in a water bath for about 30 minutes. Then the solution was cooled to room temperature, neutralized by adding 1 ml of 1 N sodium hydroxide then diluted by adding acetonitrile to the mark. After that, the solution was mixed and about 2 ml sample was withdrawn and analyzed by the developed and validated RP-HPLC method. For basic degradation study, the same procedure was followed with the following exceptions: 3 ml of 5 N sodium hydroxide was added instead of 1 ml of 5 N HCl and the solution was neutralized by adding 3 ml of 5 N HCl instead of 1 ml of 1 N sodium hydroxide. The study at each condition was repeated in triplicate.
In vitro dissolution study
In vitro dissolution of norethindrone from the prepared nanoparticulate LMF was studied according to the United States Pharmacopeia (USP) dissolution method for norethindrone tablets (United States Pharmacopeial Convention, 2014; Bansal et al., 2011a). The dissolution apparatus used was Type II Paddle dissolution apparatus (Erweka dissolution test station, USA). The dissolution medium was 900 ml 0.1 N HCl containing 0.09% sodium lauryl sulfate maintained at 37°C ± 0.5°C and 75 rpm. Fifteen milliliter of the LMF containing 0.153 mg of norethindrone/ml was placed inside a dialysis membrane (cut off = 10 kDa) and tied to the paddle. Two milliliter samples were withdrawn at suitable time intervals (0, 0.5, 1, 2, 4, 6, 8, 12, 24, 48, 72, and 96 hour) and replaced immediately with the same volume of the fresh medium. The concentration of norethindrone was determined by the developed and validated RP-HPLC. Additionally, the in vitro dissolution of the drug from the prepared LMF was studied in 0.05 M phosphate buffer pH 6.8 with 0.09% SLS. For comparison, in vitro dissolution of norethindrone alone in both media was studied. Each dissolution study was performed in triplicate.
RESULTS AND DISCUSSION
A sharp and distinct peak appeared in the resultant chromatogram at a retention time of 4.91 ± 0.2 minutes (Fig. 1).
Range
ICH guidelines recommend the following minimum specified ranges for dissolution method: ±20% over the specified range (ICH, 2005). This means that the range for the linearity evaluation should start below the typical amount recovered at the initial pull point to 120% of total drug content (Tiwari and Tiwari, 2010). However, in the literature, it is often seen that the range covers 25%–200% of the nominal concentration of the analyte (Suresh et al., 2010). In this research, the test concentration was 2.30 μg/ml and the range was from 0 to 5 μg/ml. Additionally, ICH guidelines recommend evaluating a minimum of five concentrations to assess linearity. The five concentration levels should bracket the upper and lower concentration levels evaluated during the accuracy study. In this method, seven concentrations were evaluated and the QC Low and QC High samples were bracketed between them.
 | Figure 1. Chromatogram of norethindrone at concentration 0.5 μg/ml in aqueous sample. [Click here to view] |
Linearity
The linearity of an analytical method describes its ability to give results for the conducted test that are directly proportional to the quantity of analyte in the sample (ICH, 2005). It is generally constructed by plotting area under the peak against the concentration of the drug in the standard solutions. From the plot, correlation coefficient, y-intercept, and slope can be obtained.
Linearity of the method was evaluated by injecting seven standard solutions into the system. Six calibration curves were injected on different days. The data are presented in Table 1. The coefficient of correlation (R) value was greater than 0.999 for all of the six calibration curves, which is generally considered as evidence of acceptable fit of the data to the regression line (Suresh et al., 2010).
 | Table 1. Linearity of the HPLC method of analysis of Norethindrone in dissolution media. [Click here to view] |
 | Table 2. Results of ANOVA test for the six calibration curves. [Click here to view] |
The linear fit for the obtained data is shown in Figure 2a. The results of the ANOVA test for the calibration curves are shown in Table 2. The p-value > 0.05 indicates the non-significant difference between the calibration curves run on different days. The residue analysis is shown in Figure 2b. The residue analysis exhibited a random pattern, thus the homoscedasticity assumption is satisfied indicating a good fit for the linear model.
Accuracy and precision
Accuracy of an analytical method measures the closeness of agreement between the resulted practical value obtained from the test and the expected real theoretical value of the analyte in the sample. The ICH guidelines recommend for accuracy assessment using a minimum of nine determinations over a minimum of three concentration levels, covering the specified range (i.e., three concentrations and three replicates of each concentration) (ICH, 2005; Suresh et al., 2010). It is calculated as the percentage of recovery (Validation of Compendial Procedures. USP30-NF25, 2008) using Eq. (3):
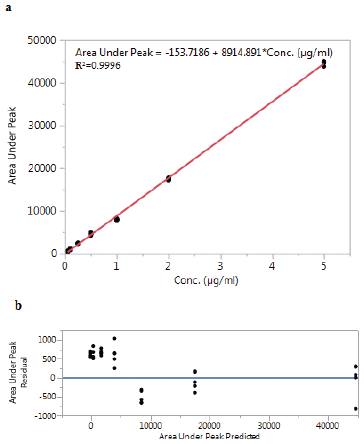 | Figure 2. a) linear fit of 6 calibration curves and b) residue analysis. [Click here to view] |
The precision of an analytical procedure is the degree of agreement among individual test results when the procedure is performed repeatedly to multiple samplings of a homogeneous sample. The precision of an analytical procedure is usually expressed as the variance, standard deviation, or coefficient of variation also known as relative standard deviation (RSD) of a series of measurements. According to the ICH, precision should be performed at three different levels; repeatability, intermediate precision, and reproducibility (between laboratories precision) (ICH, 2005; Suresh et al., 2010). Repeatability is the intra-day variation in assay obtained at different concentration levels using the same analyst with the same equipment expressed in terms of RSD calculated for each day (ICH, 2005; Rao et al., 2008). Intermediate precision is the inter-day variations which expresses within-laboratory variation, as on different days, or with different analysts or equipment within the same laboratory (ICH, 2005; Rao et al., 2008). Reproducibility is the precision between laboratories (collaborative or inter-laboratory studies) (Reddy et al., 2013).
The RSD is calculated using Eq. (4):
Typically, for assay methods, RSD between the two sets of data must be ≤2.0% (Suresh et al., 2010; Tiwari and Tiwari, 2010). Acceptance criteria similar to those applied to intermediate precision also apply to reproducibility (Tiwari and Tiwari, 2010).
The intra- and inter-day accuracy and precision were determined using six QC samples at three concentration levels. These QC samples were prepared and injected on three consecutive days. Additionally, six LLOQ samples were injected on the first day of the validation. The results are shown in Table 3. Data in Table 3 indicated that the accuracy and precision at the LLOQ and the accuracy and precision at the three concentration levels (intra- and inter-day) met the acceptance criteria (FDA, 2001; Lindholm, 2004; Suresh et al., 2010).
The results of the ANOVA test for the QC samples are presented in Table 4. The p-value > 0.05 (0.7411 for QC High and 0.7281 for QC Mid) indicates the non-significant difference between the QC samples run on the same day or different days.
Limit of detection and limit of quantitation
LOD of an analytical procedure is the lowest amount of analyte in a sample which can be detected but not necessarily quantitated as an exact value. The LOQ is the lowest amount of analyte in a sample which can be quantitatively determined with suitable precision and accuracy (ICH, 2005). For norethindrone method of analysis, LOD and LOQ were estimated from the standard deviation of the response and the slope. The calculated values of LOD and LOQ were to be 0.022 and 0.061, respectively. Experimental value of the LOQ was 0.05 μg/ml, which is the lowest point in the calibration curve. Low values of LOD and LOQ indicate the sensitivity of the method.
Specificity
Specificity is the ability of the method to accurately measure the analyte in the presence of other different molecules which may be expected to be present. These molecules might include impurities, degradants, excipients, etc. (ICH, 2005, Suresh et al., 2010).
Chromatograms of the different excipients used in the preparation of the nanoparticulate LMF and of norethindrone at a concentration of 0.5 μg/ml in 0.05 M phosphate buffer pH 6.8 are shown in Figure 3. The peak of norethindrone appeared at 4.91 ± 0.2 minutes and was well resolved from the peak of chitosan that appeared at 7.6 minutes. HP-β-CD and PVP K30 did not show peaks in the dissolution medium. Similar results were obtained in 0.1 N HCl. Thus, the results indicated the specificity of the method in both dissolution media.
Degradation studies
Forced degradation studies consist of exposing the finished product to acid or base until adequate degradation of the active ingredient has been achieved. An acceptable range of degradation may be 10%–30% but may vary based on the active ingredient being degraded (Tiwari and Tiwari, 2010). The average concentrations of norethindrone after degradation studies in both acidic and basic conditions are shown in Table 5. The initial concentration of norethindrone was 175 μg/ml. The results of degradation studies showed that the drug exhibited acceptable stability in both conditions. However, it was relatively more stable in basic condition. As the percent of degradation in acidic media was 32.55%, while in basic media was only 16.94%.
 | Table 3. Intra- and inter-day accuracy and precision of the HPLC method of analysis of Norethindrone in dissolution media. [Click here to view] |
 | Table 4. Results of ANOVA test for the inter- and intra-day accuracy and precision. [Click here to view] |
 | Figure 3. Chromatograms of the different excipients used in the nanoparticulate LMF and of norethindrone at a concentration of 0.5 μg/ml in 0.05 M phosphate buffer pH 6.8. [Click here to view] |
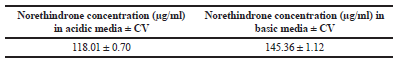 | Table 5. The average concentrations of norethindrone after degradation studies in both acidic and basic conditions. [Click here to view] |
In vitro dissolution study
The in vitro dissolution studies were carried according to USP dissolution test for norethindrone tablets (Bansal et al., 2011a; United States Pharmacopeial Convention, 2014). The dissolution apparatus used was Type II Paddle dissolution apparatus (Erweka dissolution test station, USA). The dissolution medium was 900 ml 0.1 N HCl containing 0.09% sodium lauryl sulfate maintained at 37°C ± 0.5°C and 75 rpm. Additionally, since the nanoparticulate LMF is a sustained/controlled release formulation, the dissolution was studied in 0.05 M phosphate buffer pH 6.8 to simulate fed and fasted conditions.
The release profiles of norethindrone from the nanoparticulate LMF in 0.1 N HCl and in 0.05 M phosphate buffer pH 6.8 are shown in Figure 4a and b, respectively. The difference factor (f1) and the similarity factor (f2) were calculated and used for comparing the dissolution of the nanoparticulate LMF (test) and norethindrone alone (reference). The f1 value is equal to zero when the test and reference profiles are identical and increases as the two profiles become less similar. The f2 value is equal to 100 when the test and reference profiles are identical and exponentially decreases as the two profiles become less similar (Diaz et al., 2016). f1 and f2 were 80.26 and 7.74, respectively, in 0.1 N HCl and 82.00 and 5.24, respectively, in phosphate buffer pH 6.8. These values indicated that the two dissolution profiles in each dissolution media were less similar. The dissolution of the norethindrone alone was rapid while that from the nanoparticulate LMF was sustained for 96 hours. Additionally, the release profiles of the drug from the nanoparticulate LMF in both dissolution media were fitted to different dissolution models and the R2 values were calculated by DDSolver program. The results are presented in Table 6 and indicated that the release profiles fitted best to zero order release and Korsmeyer-Peppas Models. Thus, the release of the drug from the nanoparticulate LMF was not only sustained but also controlled for 96 hours as compared to that from norethindrone alone.
 | Figure 4. In vitro release of norethindrone from LMF into a) 0.1 N HCl and b) phosphate buffer pH 6.8 at 37°C and 75 rpm. [Click here to view] |
 | Table 6. Calculated R2 values according to dissolution models in both media. [Click here to view] |
CONCLUSION
A novel RP-HPLC method coupled with UV-Vis detection was developed for the determination of norethindrone in different dissolution media and it was validated according to the ICH guidelines. The method was simple: no derivatization nor extraction was needed, the flow of the mobile phase was isocratic, only one detector was used and there was no need for coupling of two or more detectors. The method was linear in the range studied, accurate and precise. Forced degradation studies indicated that the drug exhibited acceptable stability in both conditions and was relatively more stable in basic condition.
The method was successfully used in studying the in vitro release of norethindrone from the prepared nanoparticulate LMF and compared to the dissolution of the norethindrone alone. The formula exhibited not only sustained but controlled release for 96 hours.
ACKNOWLEDGMENTS
The authors are thankful for Jordan University of Science and Technology for their financial support (347/2015).
CONFLICT OF INTEREST
The authors declare that they have no conflict of interest.
REFERENCES
Ajitha K, Kimbahune R, Mubeen G, Lalitha N, Chakraborty K. Reversed-phase high-performance liquid chromatographic determination of norethindrone acetate and ethinyl estradiol in pharmaceutical formulation. Indo Am J Pharm Res, 2015; 2242–9.
Ajitha K, Kimbahune R, Mubeen G, Pai Y. Simultaneous spectrophotometric estimation of norethindrone acetate and ethinyl estradiol in formulation. Anal Chem Ind J, 2016; 16:156–62.
Altaani BM, Al-Nimry SS, Haddad RH, Abu-Dahab R. Preparation and characterization of an oral norethindrone sustained release/controlled release nanoparticles formulation based on chitosan. AAPS PharmSciTech, 2019; 20:54.
Analytical Best Practices. Establishing acceptance criteria for analytical methods. 2016. Available via www.biopharminternational.com (Acessed 1 October 2018).
Bansal K, Pant P, Rao PRT, Padhee K, Sathapathy A, Kochhar PS. Micronization and dissolution enhancement of norethindrone. IJRPC, 2011a; 1(3):315–9.
Bansal K, Pant P, Rao PRT, Venkateswar Reddy M, Padhee K, Sathapathy A, Kochhar PS. UV spectrophotometric method for the estimation of norethindrone in immediate release tablet. Int J Pharm Sci Drug Res, 2011b; 3:127–9.
Diaz DA, Colgan ST, Langer CS, Bandi NT, Likar MD, Alstine LV. Dissolution similarity requirements: how similar or dissimilar are the global regulatory expectations? AAPS J, 2016; 18(1):15–22.
Food, Drug Administration Centre for Drug Evaluation and Research (FDA). Guidance for industry-bioanalytical method validation, center for drug evaluation and research. US Department for Health and Human Services, 2013, Silver Spring, MD, 2001.
Goeh TJ, Sundaresan GM, Prasad VK. Analytical methodology applicable in dissolution of norethindrone-mestranol. Int J Pharm, 1982; 11:181–6. CrossRef
Hashem H, Abd El-Hay S, Jira T. A rapid stability indicating HPLC-method for determination of norethisterone acetate in plasma, tablets and in a mixture with other steroids. Int J Pharm Pharmaceut Sci, 2015; 7:279–82.
Hirai S, Hussain A, Babhair S. Sensitive method for determination of ethinyl estradiol in presence of norethindrone. J Pharm Sci, 1980; 69:857–9; doi:10.1002/jps.2600690732. CrossRef
International conference on the harmonization of technical requirements for the registration of pharmaceuticals for human use. ICH harmonized tripartite guideline validation of analytical procedures: text and methodology Q2 (R1). Current Step 4 version, Parent Guideline dated 27 October 1994 (Complementary Guideline on Methodology dated 6 November 1996 incorporated in November 2005).
Krishna PM, Rao BT, Kumar RK, Venkateswarlu P. Development and validation of method for the determination of related substances of norethindrone in norethindrone tablets and degradation studies. Int J ChemTech Res, 2011; 3:143–8.
Lo’pez de Alda MJ, Barcelo D. Determination of steroid sex hormones and related synthetic compounds considered as endocrine disrupters in water by liquid chromatography–diode array detection–mass spectrometry. J Chromatogr A, 2000; 892:391–406. CrossRef
Lindholm J. Development and validation of HPLC methods for analytical and preparative purposes. Dissertation, Acta Universitatis Upsaliensis, Uppsala, Sweden, 2004.
Norethindrone Tablets. The United States Pharmacopeial Convention, 2014. Available at https://www.uspnf.com/official-text/revision-bulletins/norethindrone-tablets (Accessed 12 January 2019)
Rao R, Talluri MV, Raju AN, Shinde DD, Ramanjaneyulu GS. Development of a validated RP-LC/ESI-MS–MS method for separation, identification and determination of related substances of tamsulosin in bulk drugs and formulations. J Pharm Biomed Anal, 2008; 46:94–103; doi:10.1016/j.jpba.2007.09.009.
Reddy LS, Reddy SLNP, Reddy GS. Development and validation of a stability indicating liquid chromatographic method for simultaneous estimation of dutasteride and tamsulosin in combined dosage form. Orient J Chem, 2013; 29(4):1665–73.
Santos M, Hendry D, Sangi-Haghpeykar H, Dietrich JE. Retrospective review of norethindrone use in adolescents. J Pediatr Adolesc Gynecol, 2014; 27:41–4; doi:10.1016/j.jpag.2013.09.002. CrossRef
Schindler AE, Campagnoli C, Druckmann R, Huber J, Pasqualini JR, Schweppe KW, Thijssen JH. Classification and pharmacology of progestins. Maturitas, 2003; 46 Suppl:S7–16. CrossRef
Suresh R, Anarthanan S, Manavalan R, Valliappan K. Aspects of validation in HPLC method development for pharmaceutical analysis—comparison of validation requirements by FDA, USA and ICH. Int J Pharm Sci Res, 2010; 12:123–33; doi:10.13040/IJPSR.0975-8232.1(12).123-32. CrossRef
Tiwari G, Tiwari R. Bioanalytical method validation: an updated review. Pharm Methods, 2010; 1(1):25–38; doi:10.4103/2229-4708.72226. CrossRef
Validation of Compendial Procedures. USP30-NF25, 2008. Available via http://www.uspnf.com/uspnf/pub/getPFDocument?usp=30&nf25&supp=2&collection=/db... 2/11/2008. (Accessed 25 March 2017).
Venkateswarlu K, Rangareddy A, Narasimhaiah K, Sharma H, Mallikarjuna N, Bandi R. A validated stability indicating RP-HPLC method for estimation of armodafinil in pharmaceutical dosage forms and characterization of its base hydrolytic product. Pak J Pharm Sci, 2017; 30(1):23–8.